Inspect
- Deutsch: Diese Seite ist nicht ins Deutsche übersetzt
Inspect is the full-screen workspace where you review an asset's images and other media, act on the AI's suggested defects, and record your own observations. You open Inspect for one task at a time, work through its assets one by one, and mark each asset complete as you go. Drawing observations, handling the AI's suggestions, and running quality assurance each have their own part of this page.
Opening a task and moving around Inspect
Steps to open a task in Inspect
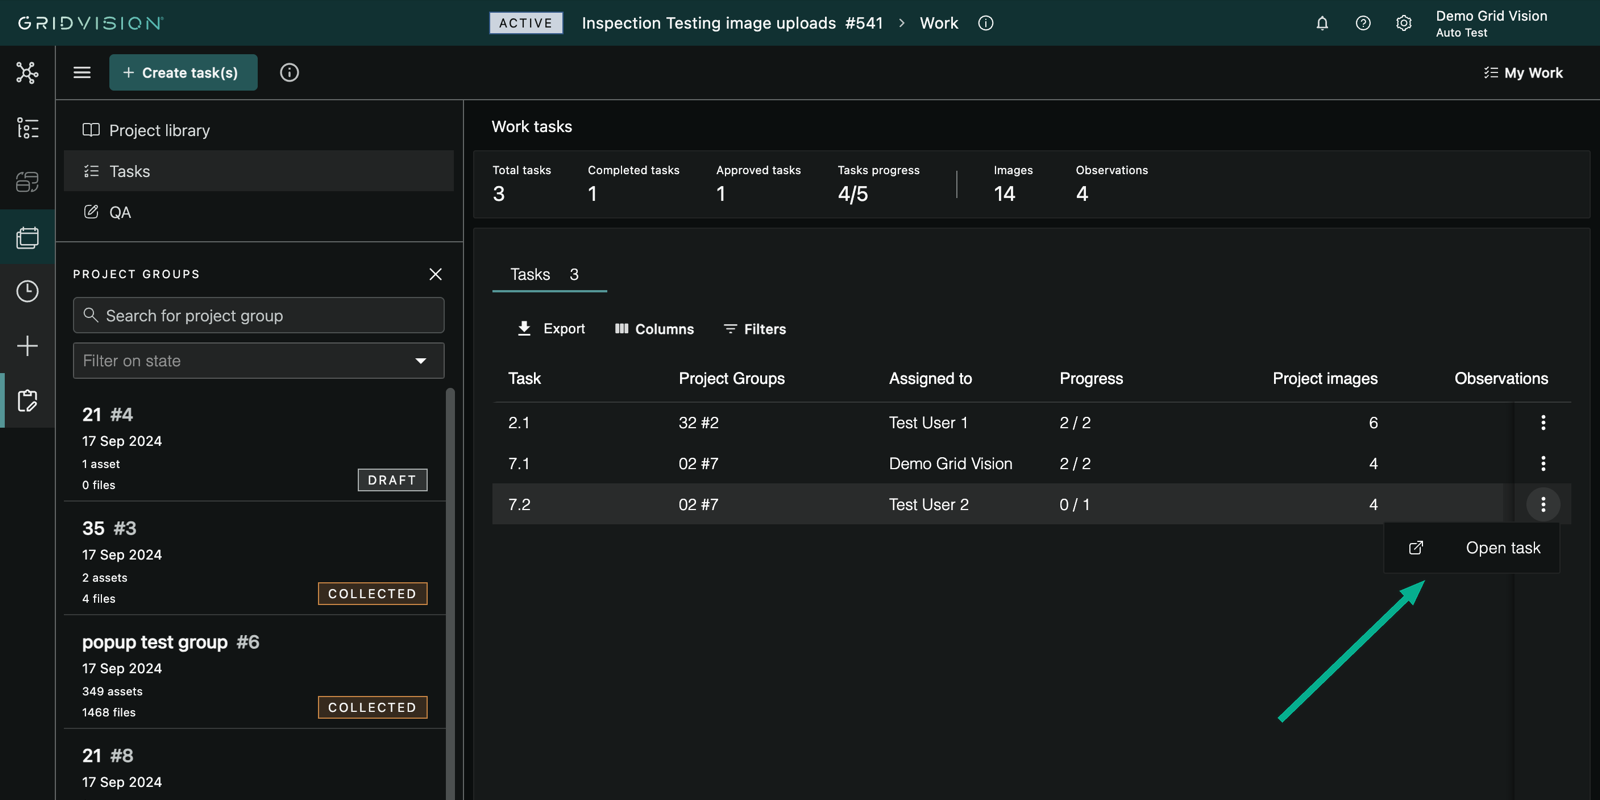
- Go to the Work module and open the Tasks view. Each inspection task is listed in the Work tasks grid view.
- Hover over the row of the task you want to inspect. A menu button (three dots) appears at the end of the row.
-
Click the menu button and choose Open task. The task opens in Inspect in a new browser tab, so your task list stays open in the tab you came from.
-
Ensure that Inspect opens showing the first asset of the task, with the task context shown at the top of the screen.
The Inspect workspace
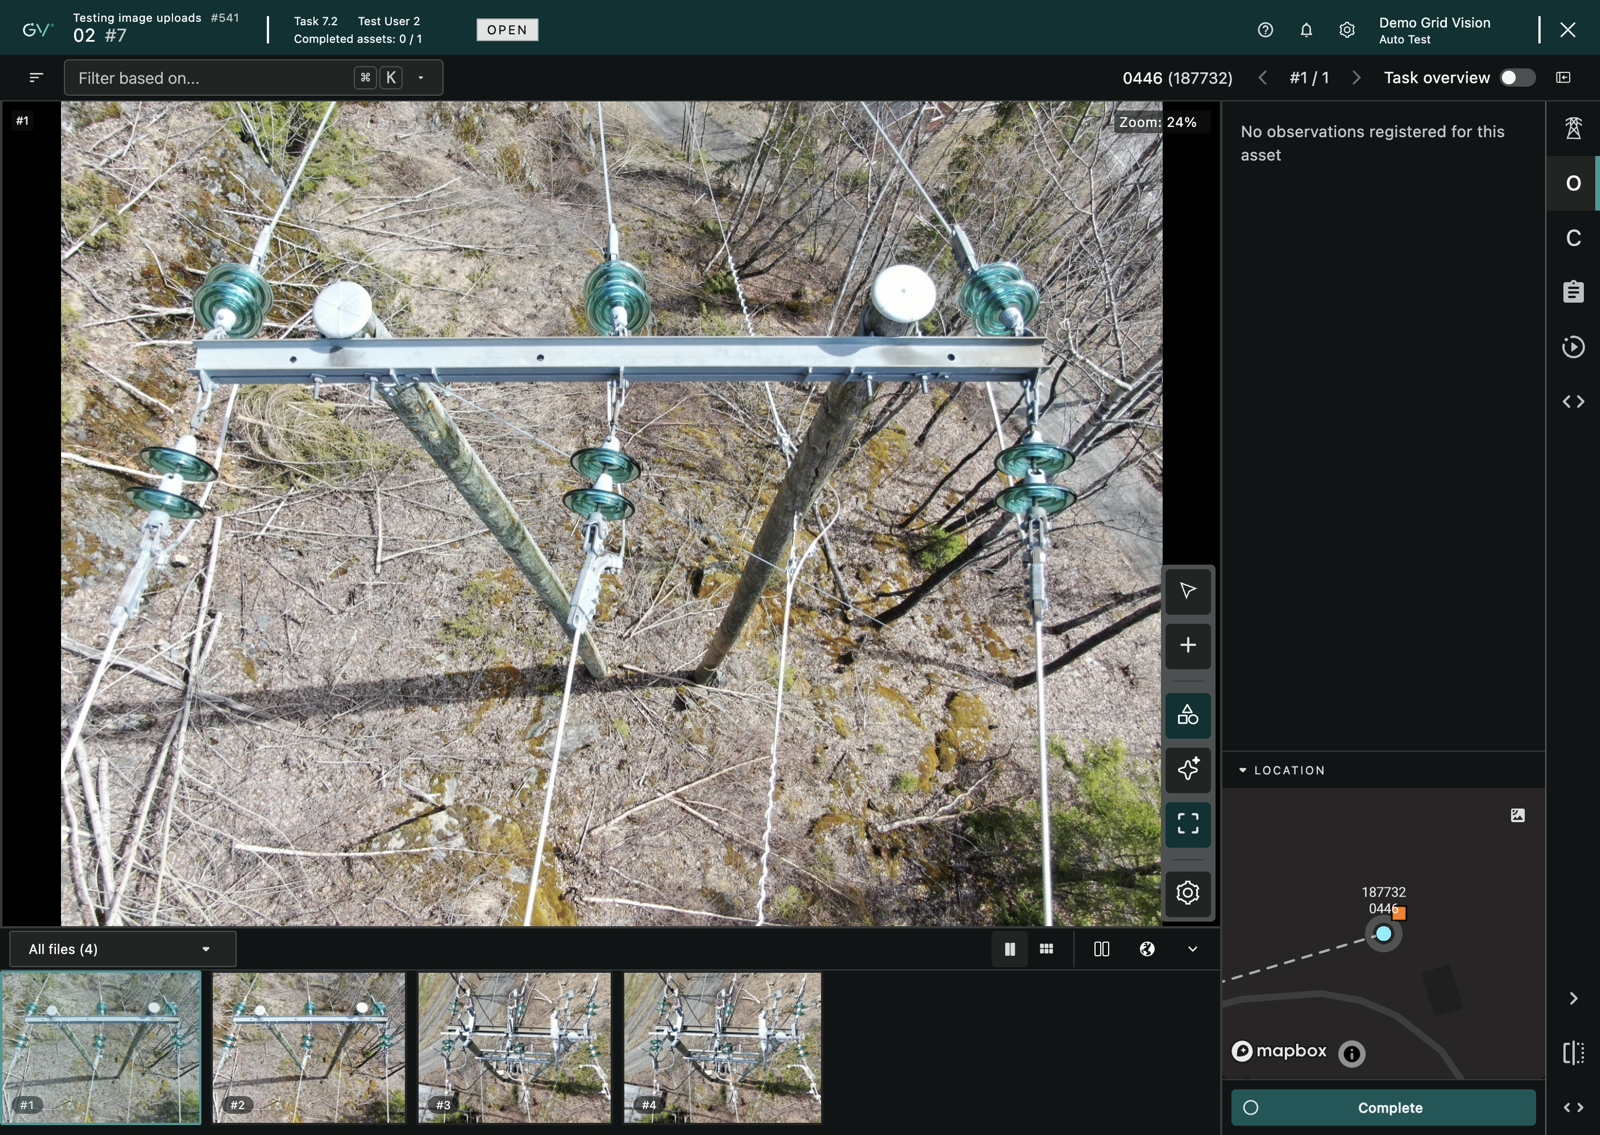
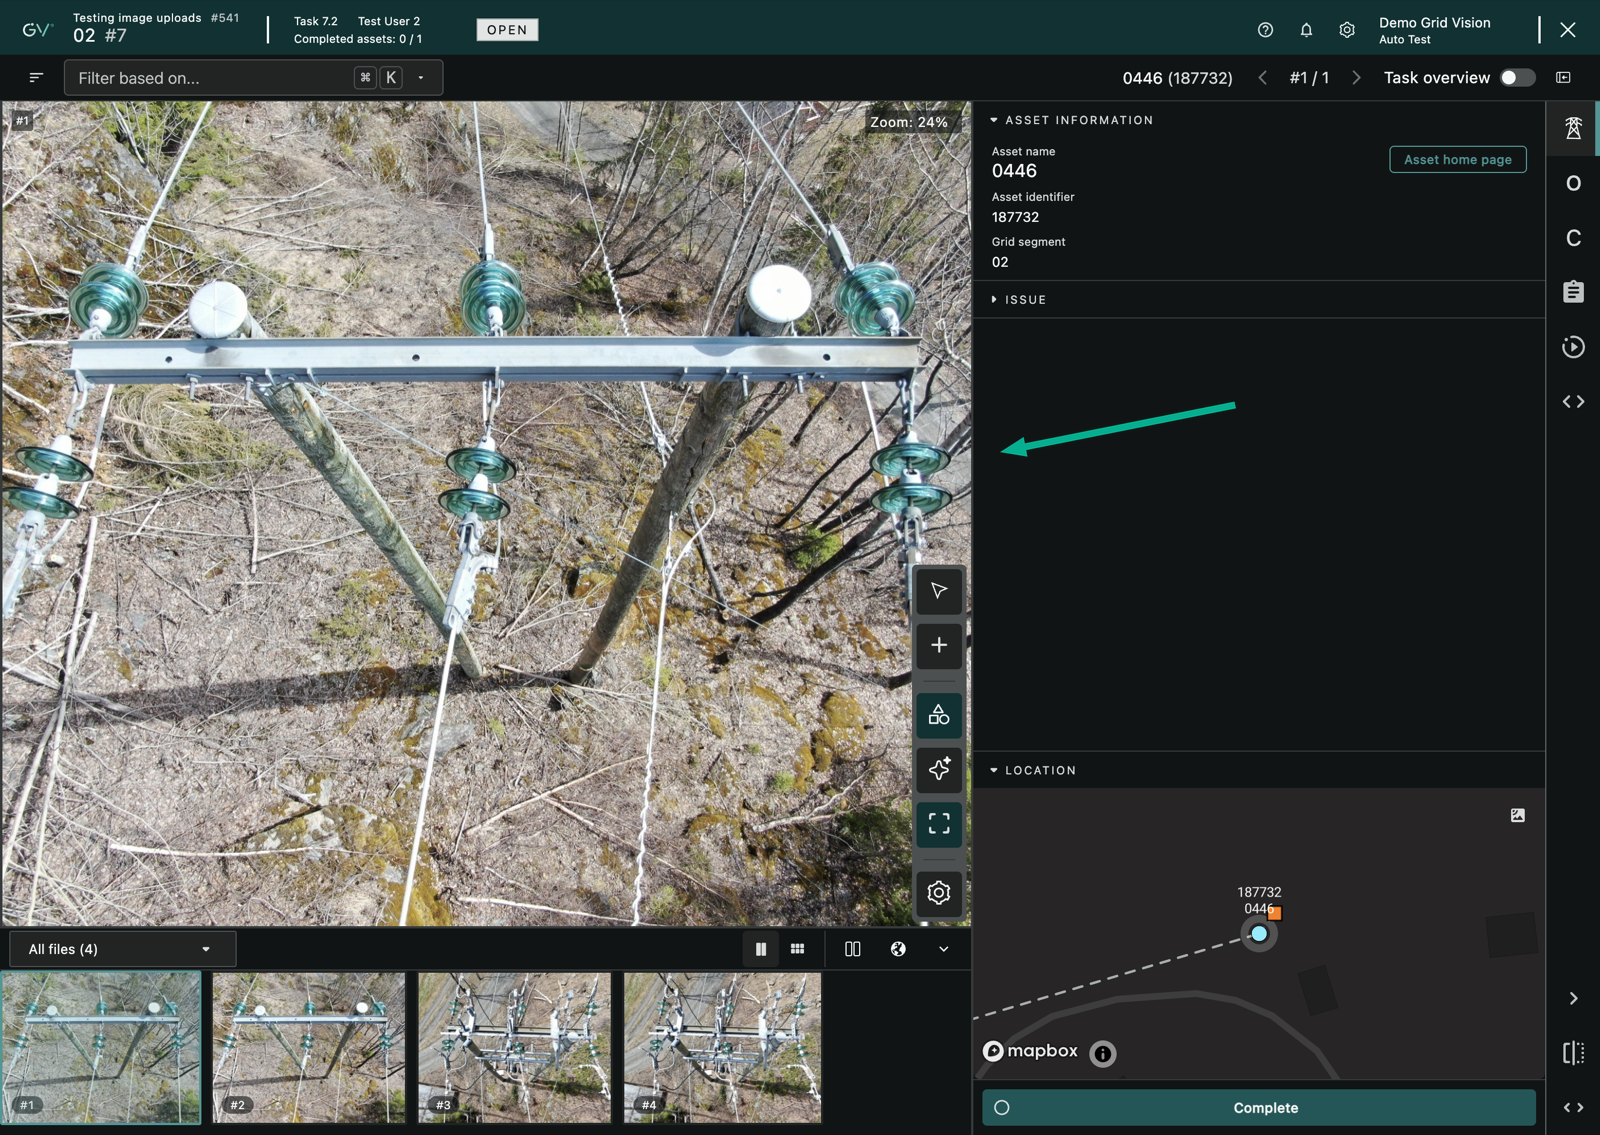
Once a task is open, Inspect fills the screen with a few distinct areas.
Across the top is the module bar. On the far side it shows the context you are working in, the project and its number, the project group and its number, and the current task, so you always know where you are. The rest of the module bar holds the controls for moving between assets, the sort and filter tools, the Task overview toggle, and the button that shows or hides the side panel.
The side panel runs down one side of the screen and is where the detail lives. A strip of tabs switches it between Asset information, Observations, Components, and File details. You can move the side panel to the other side, collapse it to reclaim space, or widen its tab labels. How the panel is divided and what each tab shows is covered in Split screen and panel logic.
The main content area in the middle is the image viewer. It shows the selected file at full size, with any observations and AI suggestions drawn on top of it as boxes, and it carries its own zoom and drawing tools. Inspect also handles panoramas, point clouds and audio, each with a viewer suited to that kind of file. You can open a second viewer or a map beside the main one, which is also covered in Split screen and panel logic.
Along the bottom is the filmstrip, a row of thumbnails for every file on the current asset. The file you are viewing is highlighted, and each thumbnail carries small badges that tell you at a glance how many observations or suggestions sit on that file.
Steps to move between assets
- Use the previous asset and next asset arrows in the module bar to step through the assets in the task. Between the arrows, a counter shows which asset you are on and how many there are in total, next to the current asset's name and identifier.
- Alternatively, press n to move to the next asset and Shift+n to move to the previous one.
- Ensure that the image viewer, side panel and filmstrip all update to the new asset when you move.
When you mark an asset complete, Inspect moves you on to the next asset that still needs work automatically, so you can keep a steady rhythm through the task. Completing an asset is covered in Task overview and shared filters.
Steps to move between the files of an asset
- Click any thumbnail in the filmstrip to open that file in the image viewer.
- Alternatively, press k to move to the next media and j to move to the previous media.
- With the filmstrip focused, you can also use the arrow keys to step through the thumbnails.
-
Ensure that the selected thumbnail is highlighted in the filmstrip and shown at full size in the image viewer.
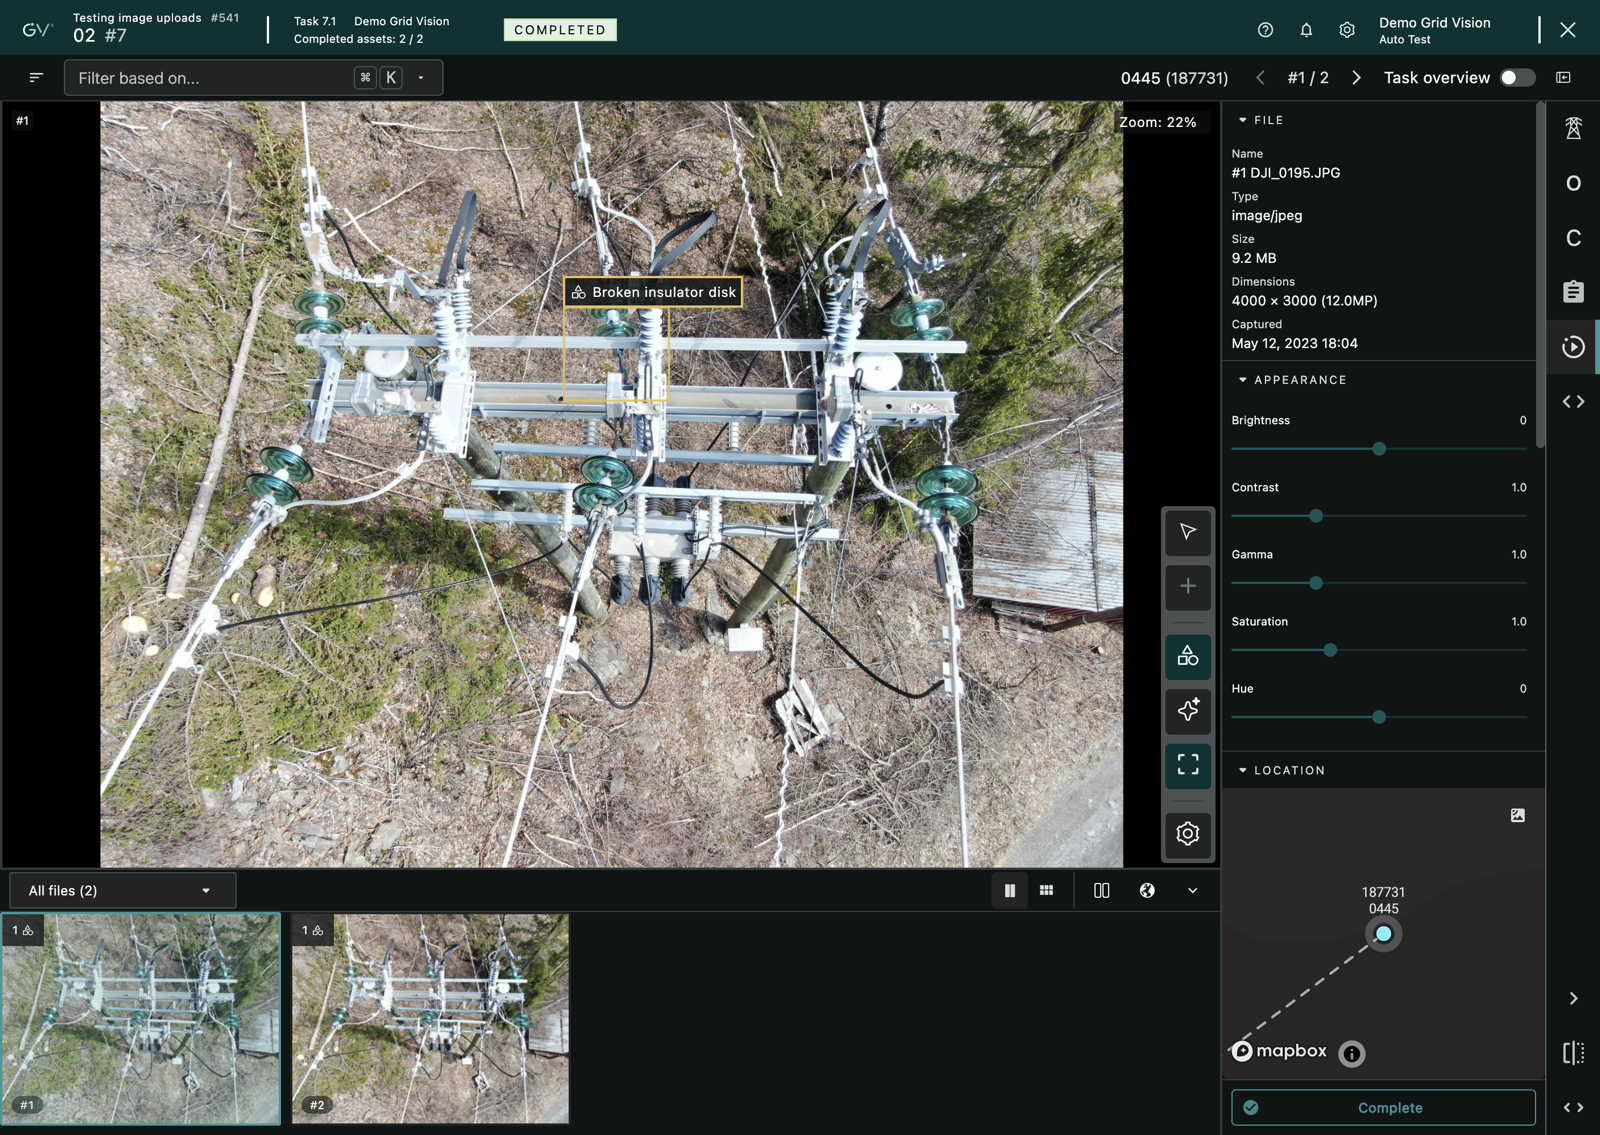
You can filter the filmstrip to a kind of file, for example only regular images, only point clouds, or only the files that carry suggestions, and switch it between a single-row filmstrip and a multi-column gallery. Those controls sit on the filmstrip's own toolbar.
Split screen and panel logic
The Inspect workspace is built from panels you can rearrange to suit the job in front of you. The side panel holds the detail for the current asset, the image viewer shows the file you are working on, and you can open a second viewer or a map beside it to compare views.
The side panel and its tabs
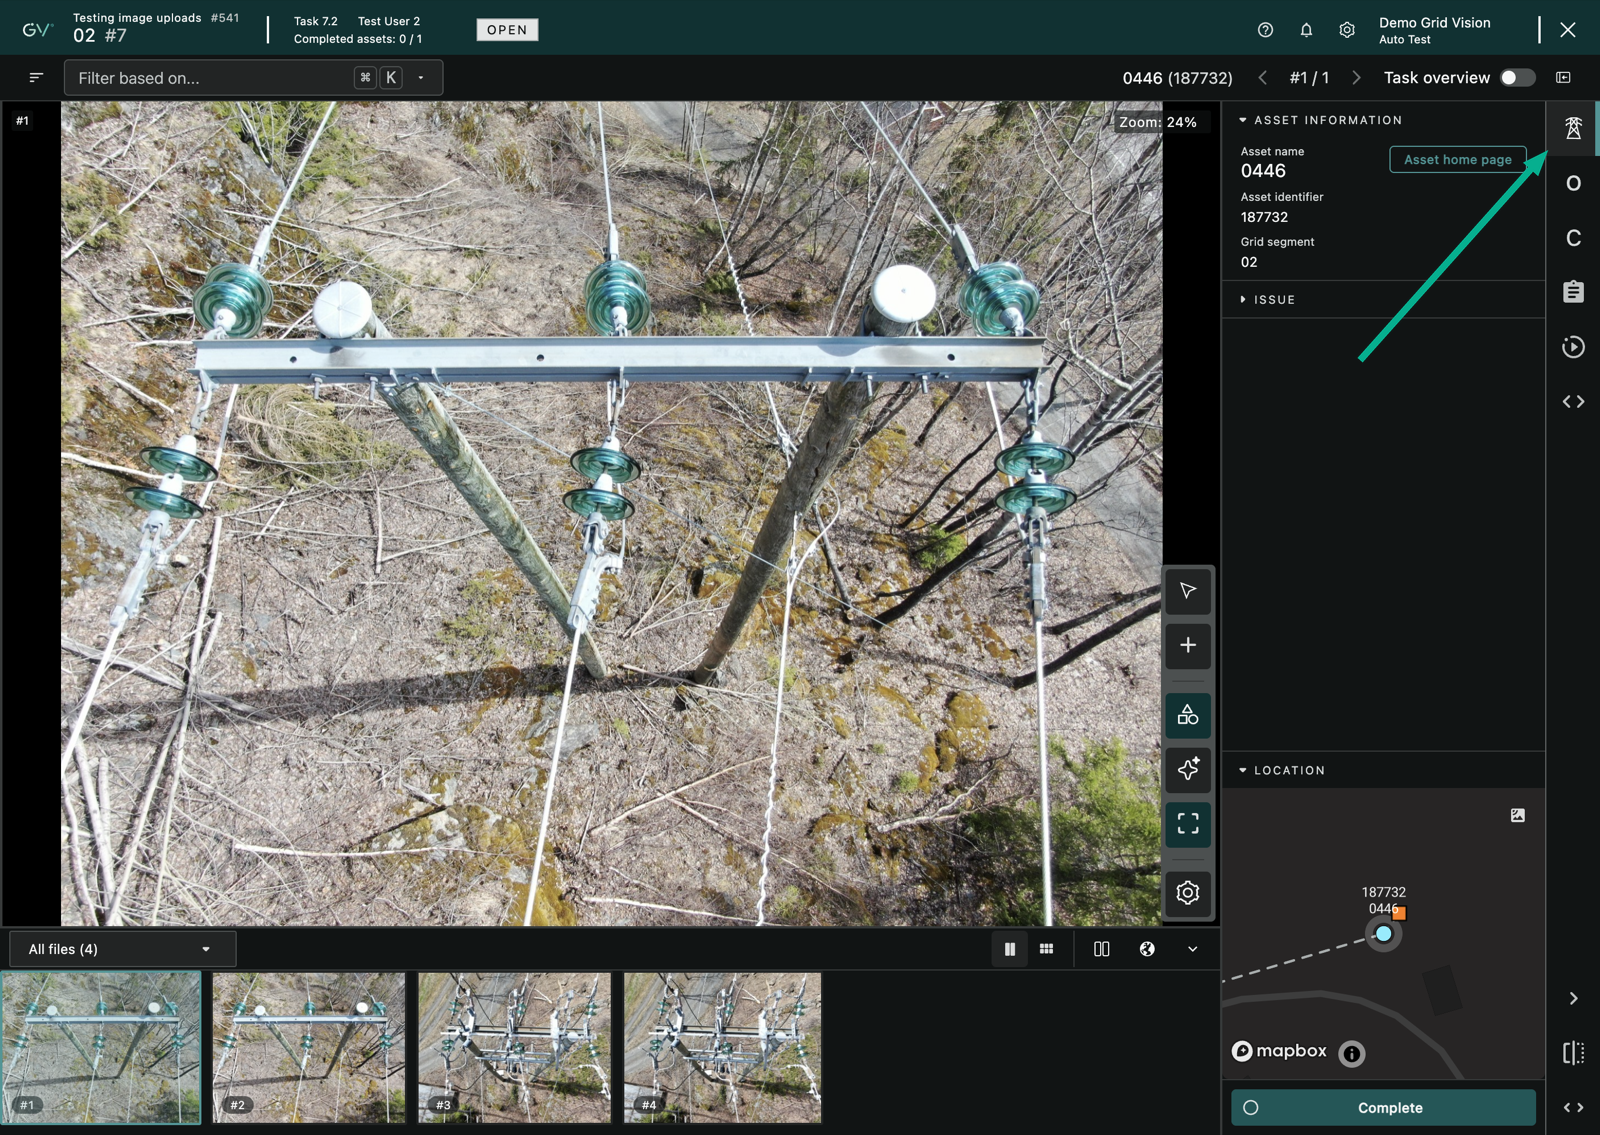
The side panel is the strip of detail down one side of the screen, and a column of tabs decides what it shows. Selecting a tab switches the panel to that content without leaving the asset.
- Asset information shows an overview of the current asset, and lets you log an issue on the asset when something needs flagging. This tab is always available.
- Observations lists the confirmed observations recorded on the asset, grouped so you can expand a type to see its individual entries. Selecting an entry highlights it on the image. This tab becomes available once an asset is loaded.
- Components shows the components on the asset together with the AI's component suggestions, grouped by type. This tab becomes available once an asset is loaded.
- File details shows the technical detail of the file you are currently viewing, and is available once a file is selected.
For thermal images, a Thermal tab also appears so you can read temperatures from the image. It shows up only on thermal files and only if you are allowed to use the thermal reader, so the tab is there when the tool applies and hidden when it does not.
Steps to arrange the side panel
- Click a tab to open the side panel on that content. Clicking the tab that is already open collapses the side panel, and clicking any tab again reopens it.
- Use the collapse control at the foot of the tab rail to hide the side panel entirely and give the image viewer the full width. You can also collapse it by dragging its edge fully closed.
- Use the show or hide side panel button in the module bar to toggle the panel without changing which tab is selected.
- Use the move panel control to send the side panel to the other side of the screen, so it sits on whichever side you prefer.
- Use the expand control to widen the tab rail so each tab shows its name as well as its icon.
- Ensure that a disabled tab, one that is greyed out because its content is not available yet, cannot be selected.
How the image viewer and the panels work together
The image viewer in the main content area is where you draw and edit. It shows the selected file at full size with observations and AI suggestions drawn on top as boxes, and it carries its own zoom and drawing tools. Selection is shared between the viewer and the side panel, so when you select an observation or a suggestion in the Observations or Components list the viewer highlights the matching box and brings it into view, and selecting a box on the image highlights its entry in the list. Pressing Home resets the viewer to its default zoom and position. The viewer also carries toggles for showing and hiding the observation and suggestion boxes, described in Show and hide observations.
The split viewer and the map
You can split the main content area to show a second view beside the file you are inspecting. The second view can be either a map that places the current asset and its neighbours in context, or a second media file, for example a point cloud opened next to a photo of the same defect. Only the main viewer is editable; the companion view beside it is for reference. The controls for the split sit on the filmstrip's toolbar at the bottom of the screen.
Steps to use the split viewer
- Click the Split view button to open a second view beside the main viewer, and click it again to close it.
- Click the Show map button to open the map in the companion view, or to close it if the map is already showing.
- Where a point cloud is available for the asset, click the Show point cloud button to open it in the companion view next to the current image.
- Drag the divider between the two views to change how the space is shared, and double-click the divider to reset them to an even split.
- Use the swap control on the divider to swap which view is on which side.
-
Ensure that only the main viewer accepts drawing and editing, while the companion view stays read-only.
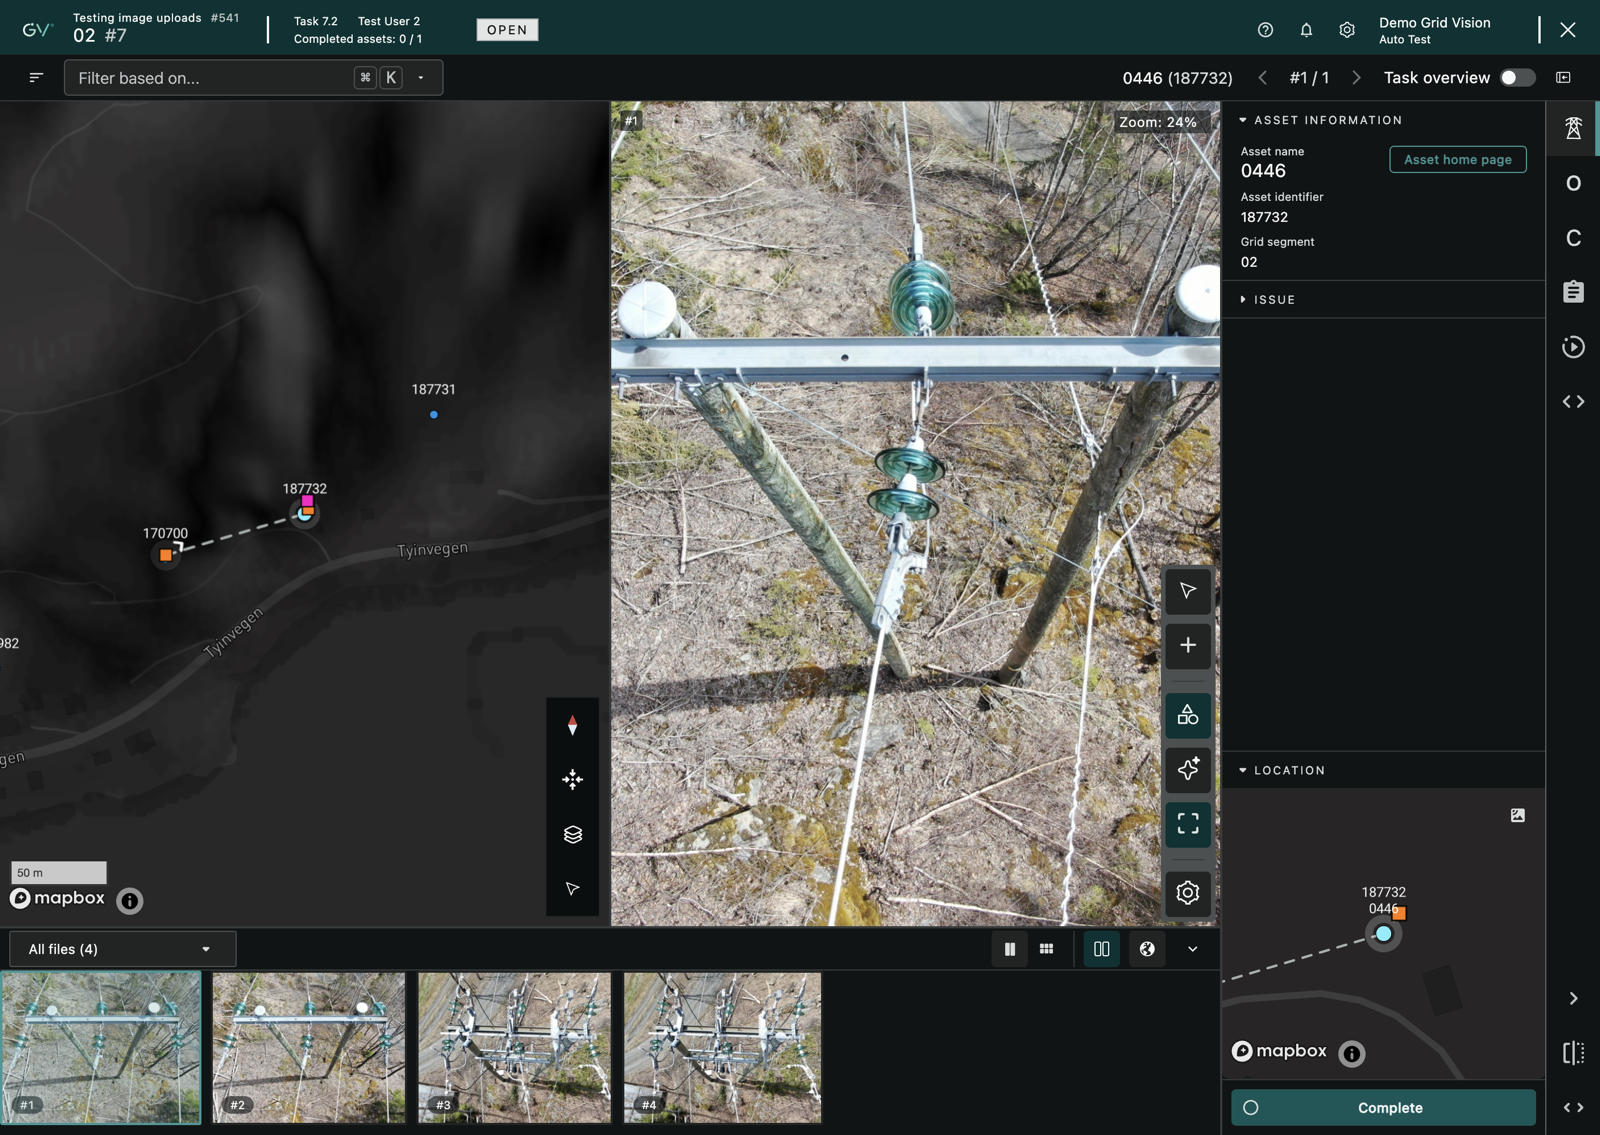
The companion view can also be popped out into a separate browser window, which is useful on a second screen. Use the pop-out control on the companion view to move it into its own window, and close that window to bring it back inline.
Steps to size the panels
- Drag the divider between the side panel and the image viewer to make the side panel wider or narrower.
- Drag the divider between the image viewer and the filmstrip to make the filmstrip taller or shorter.
- Use the collapse control on the filmstrip's toolbar to reduce the filmstrip to just its toolbar, and expand it again from the same control.
-
Ensure that Inspect remembers your panel sizes and the side panel's position as you keep working, so the layout you set up stays put.
Task overview and shared filters
The task overview gives you the whole task at a glance instead of one asset at a time, so you can see how far along the inspection is and jump to the asset you want. Inspect also shares a set of filters and a sort order across the task, so once you narrow the work down it stays narrowed as you move around.
The task overview
Open the task overview with the Task overview toggle in the module bar. It replaces the single-asset view with a summary of the whole task. At the top, a row of totals sums up the task: the number of observations and AI suggestions recorded, and the counts of the kinds of file it contains, such as images, point clouds and audio (a kind only appears when the task has at least one of it). Below the totals, a status line shows where the task stands and carries the Complete task action. The rest of the view is a grid view of every asset in the task, one row per asset, showing each asset's progress and its observation, suggestion and severity or priority figures, depending on how your project is configured. Selecting an asset takes you back into the single-asset view on that asset, so the task overview doubles as a way to navigate.
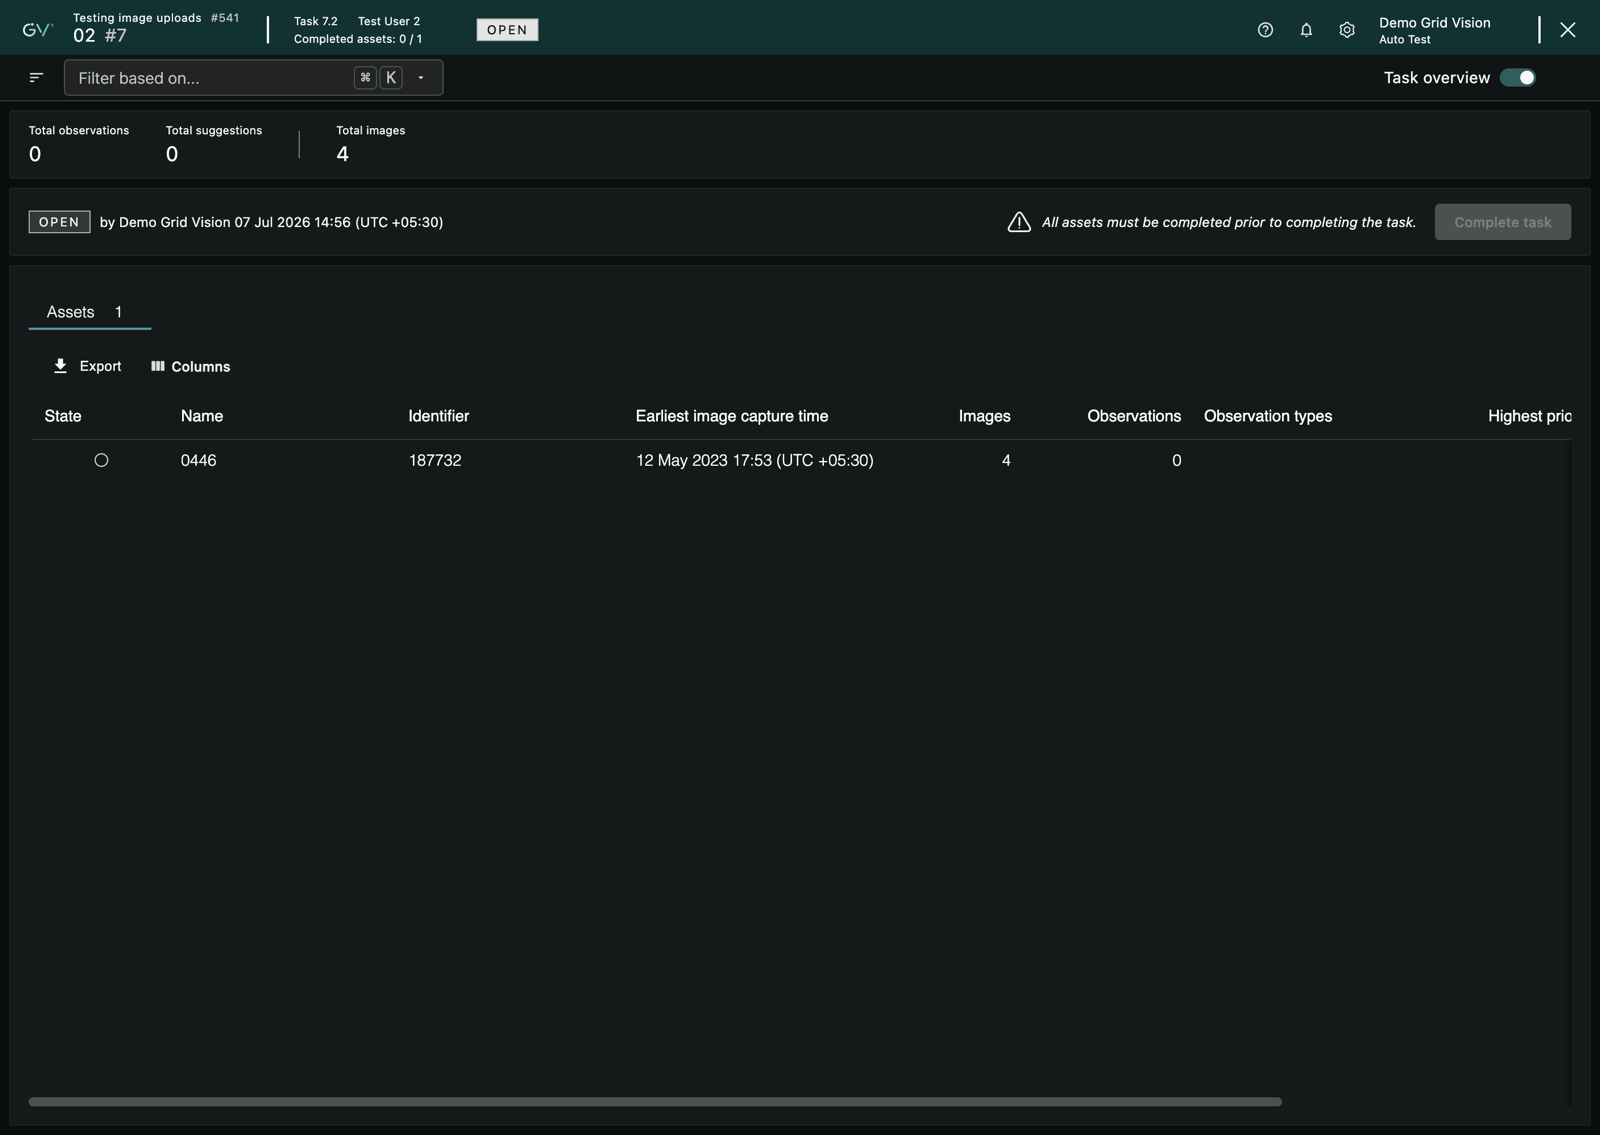
Turn the Task overview toggle off again to return to the single-asset view.
Steps to complete an asset
- Work through the asset, recording the observations it needs and reviewing the AI suggestions on its files.
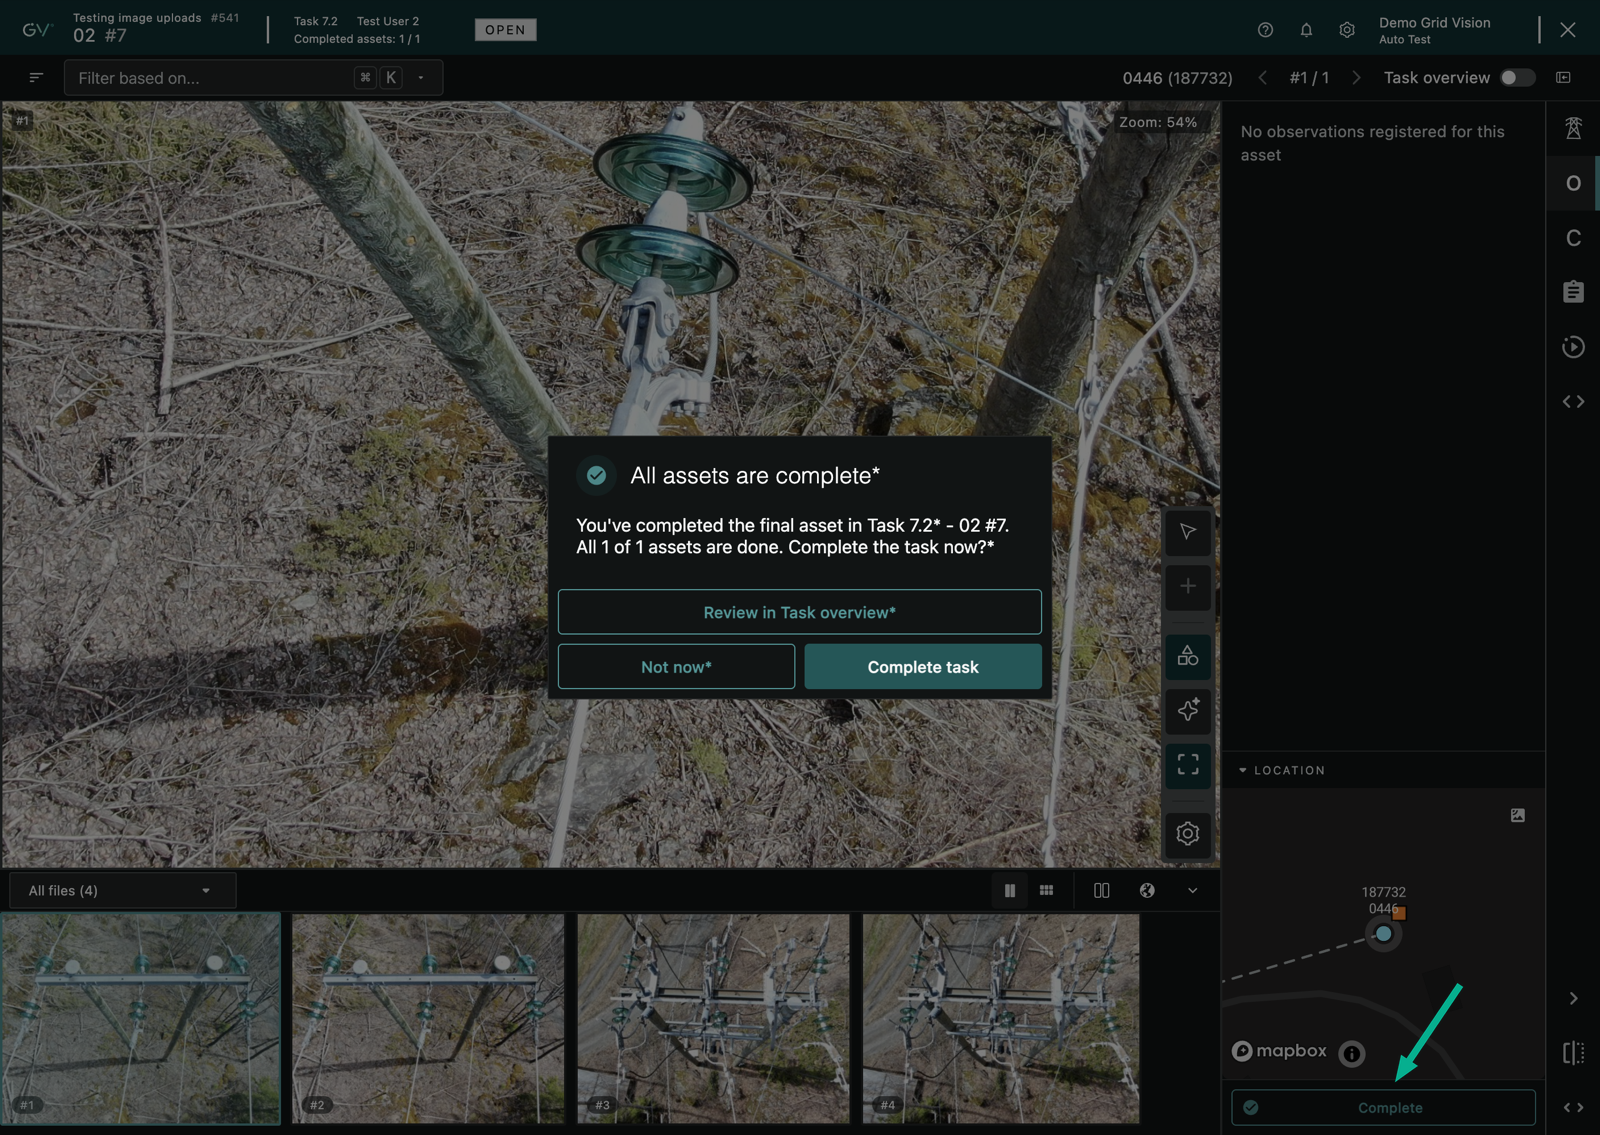
- Click Complete to mark the asset as done. Inspect then moves you on to the next asset that still needs work automatically.
- Ensure that a completed asset shows as complete, and that Inspect takes you to the next unfinished asset rather than the very next one in order.
- To reopen an asset you have completed, click Complete again to return it to a draft state so you can keep editing it.
When you complete the last remaining asset in the task, Inspect prompts you to complete the whole task. The prompt is titled All assets are complete and offers Review in Task overview, Not now, and Complete task.
Steps to complete the task
- Complete every asset in the task. The Complete task action on the task overview's status line stays disabled until all of the task's assets are complete.
- Open the Task overview and click Complete task on the status line.
- Ensure that the task's status updates to reflect that it is complete.
If not every asset is finished, the status line reads, "All assets must be completed prior to completing the task." If the task requires quality assurance, completing it is what makes QA available, which is covered in the Work section's QA page.
Shared filters
The filter tools in the module bar narrow down the assets you are working with, and the narrowing is shared: the same filter applies whether you are stepping through assets one at a time or looking at the task overview grid. This lets you focus a large task on just the assets that matter, for example those carrying suggestions or those above a certain severity. Which filters are offered depends on what the task actually contains, so you only see filters that can do something. Filters you may see include severity or priority, when images were captured, the number of images or files, and the number or type of AI suggestions. The totals at the top of the task overview reflect your active filters and show the unfiltered totals alongside, so you can see both the filtered figure and the full picture.
- Open the filter tools in the module bar and set the filters you want.
-
Ensure that both the single-asset navigation and the task overview grid narrow to the assets that match.
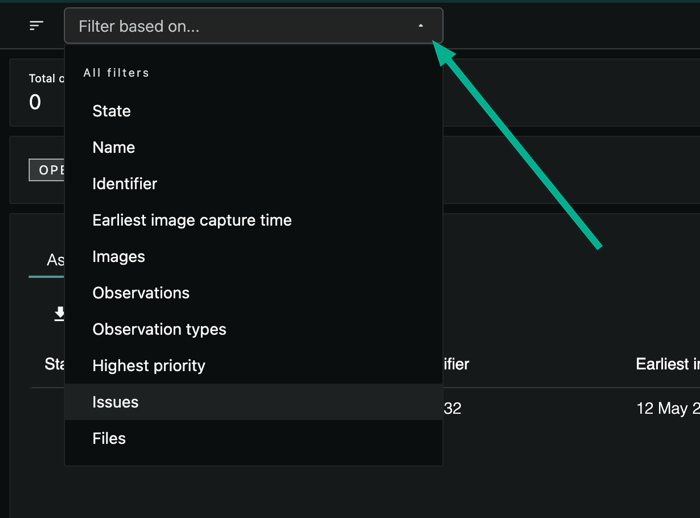
Inspect remembers your filters for the task you are on, so they are still in place when you come back to it. Your filters are tied to that task, so moving to a different task starts you with a clean set rather than carrying the previous task's filters across.
Shared sorting
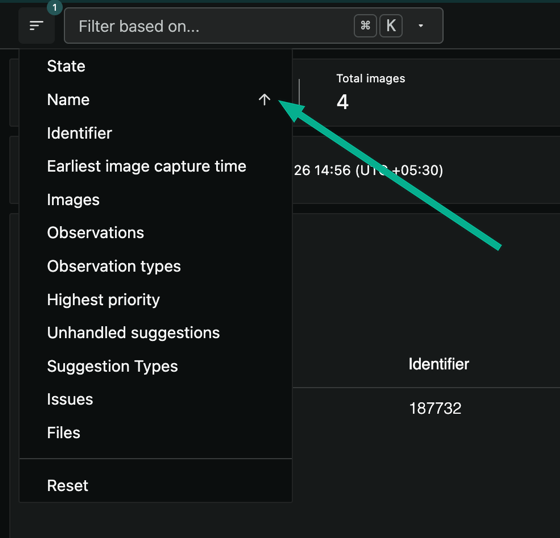
Alongside the filters, a sort control in the module bar sets the order of the assets, and that order is shared across the single-asset navigation and the task overview grid in the same way.
- Open the sort control in the module bar and choose the field to sort by.
- Click a field once to sort ascending, again to sort descending, and once more to remove it. You can sort by up to two fields at a time, and a count on the sort control shows how many sorts are active.
- Use the reset option in the sort menu to clear the sorting.
-
Ensure that the assets reorder in both the navigation and the task overview grid to match your chosen sort.
Creating an observation
An observation records a defect or point of interest on an asset's media. In Inspect you create observations one at a time by drawing a bounding box, or several at once by multi-selecting the AI's suggestions. You can also merge several suggestions into a single observation backed by more than one image, which is covered in Multi-image observations.
Steps to create a single observation
- Open the asset in Inspect and select the image you want to annotate.
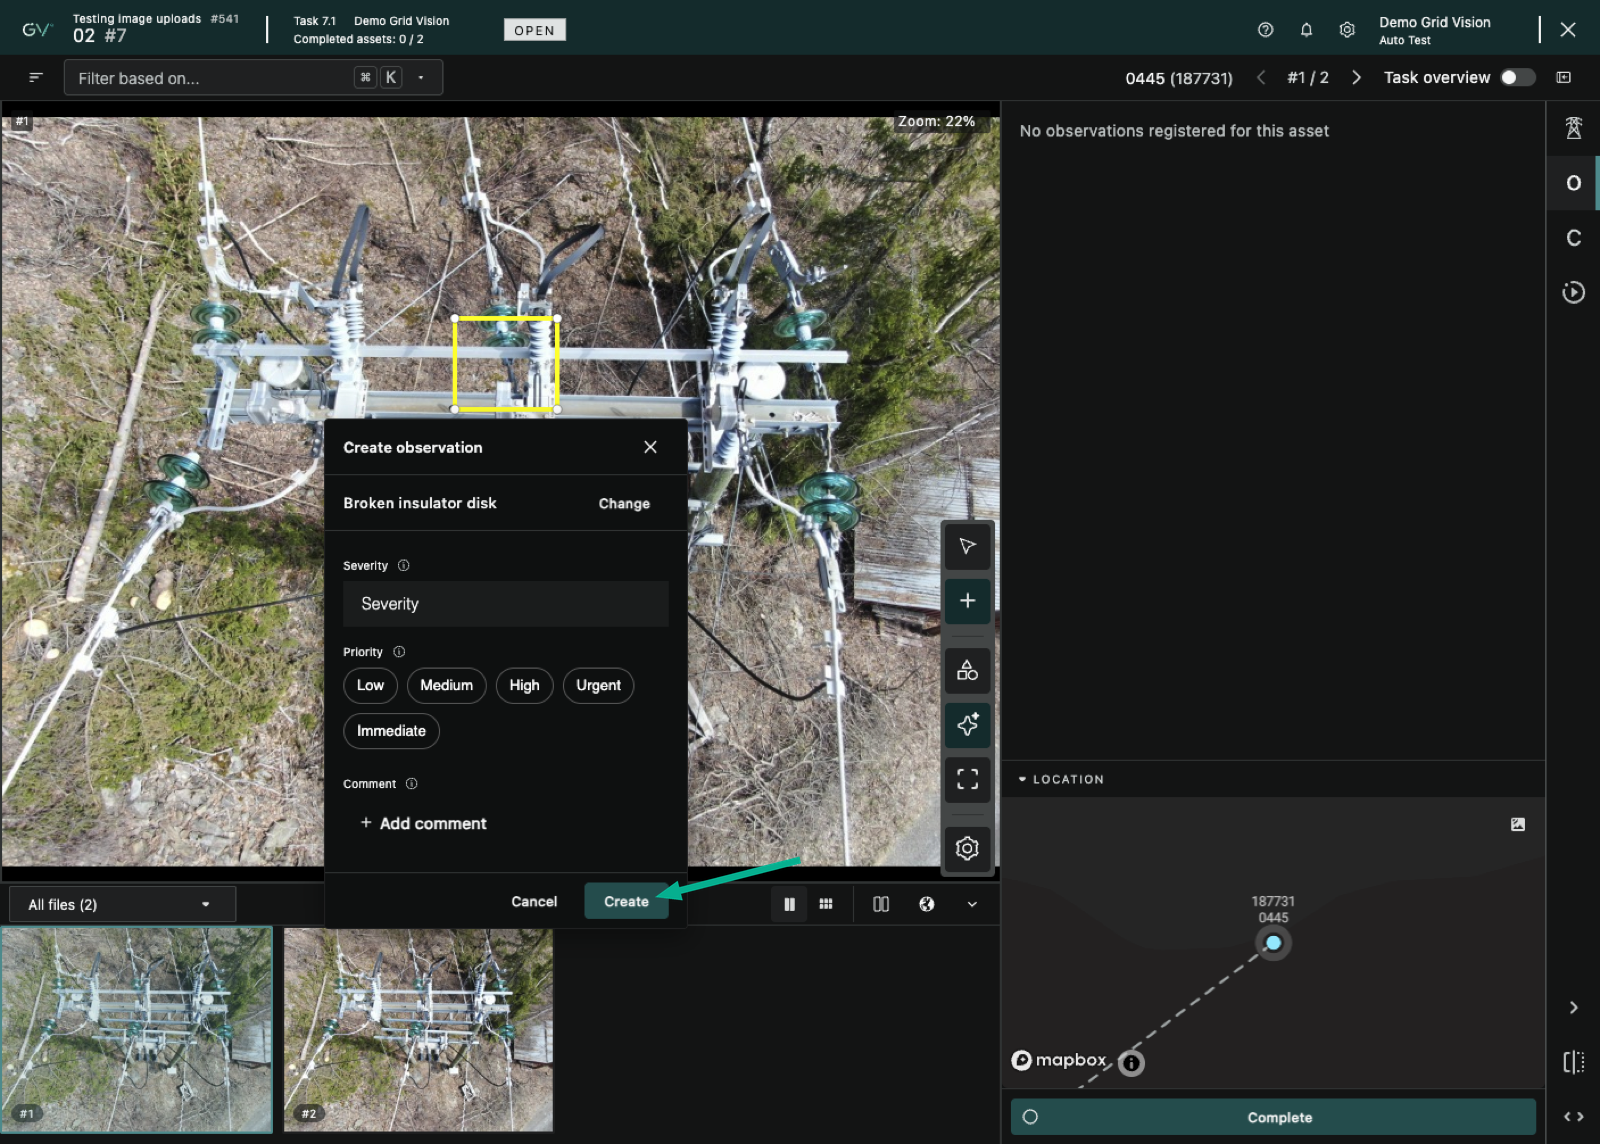
- Click the Create observation tool on the image toolbar, then press, hold and drag on the image to draw a bounding box around the defect. Resize handles appear on the box so you can adjust it while you draw.
- In the observation form that opens next to the box, open Select observation type and search for the component, or pick a recently used type.
- Set the severity, the priority (the priority buttons are Low, Medium, High, Urgent and Immediate), and any other properties. The available properties depend on how your project is configured.
- Add a comment if you need one.
-
Click Create. The button enables once every required property is set.
Steps to create several observations at once
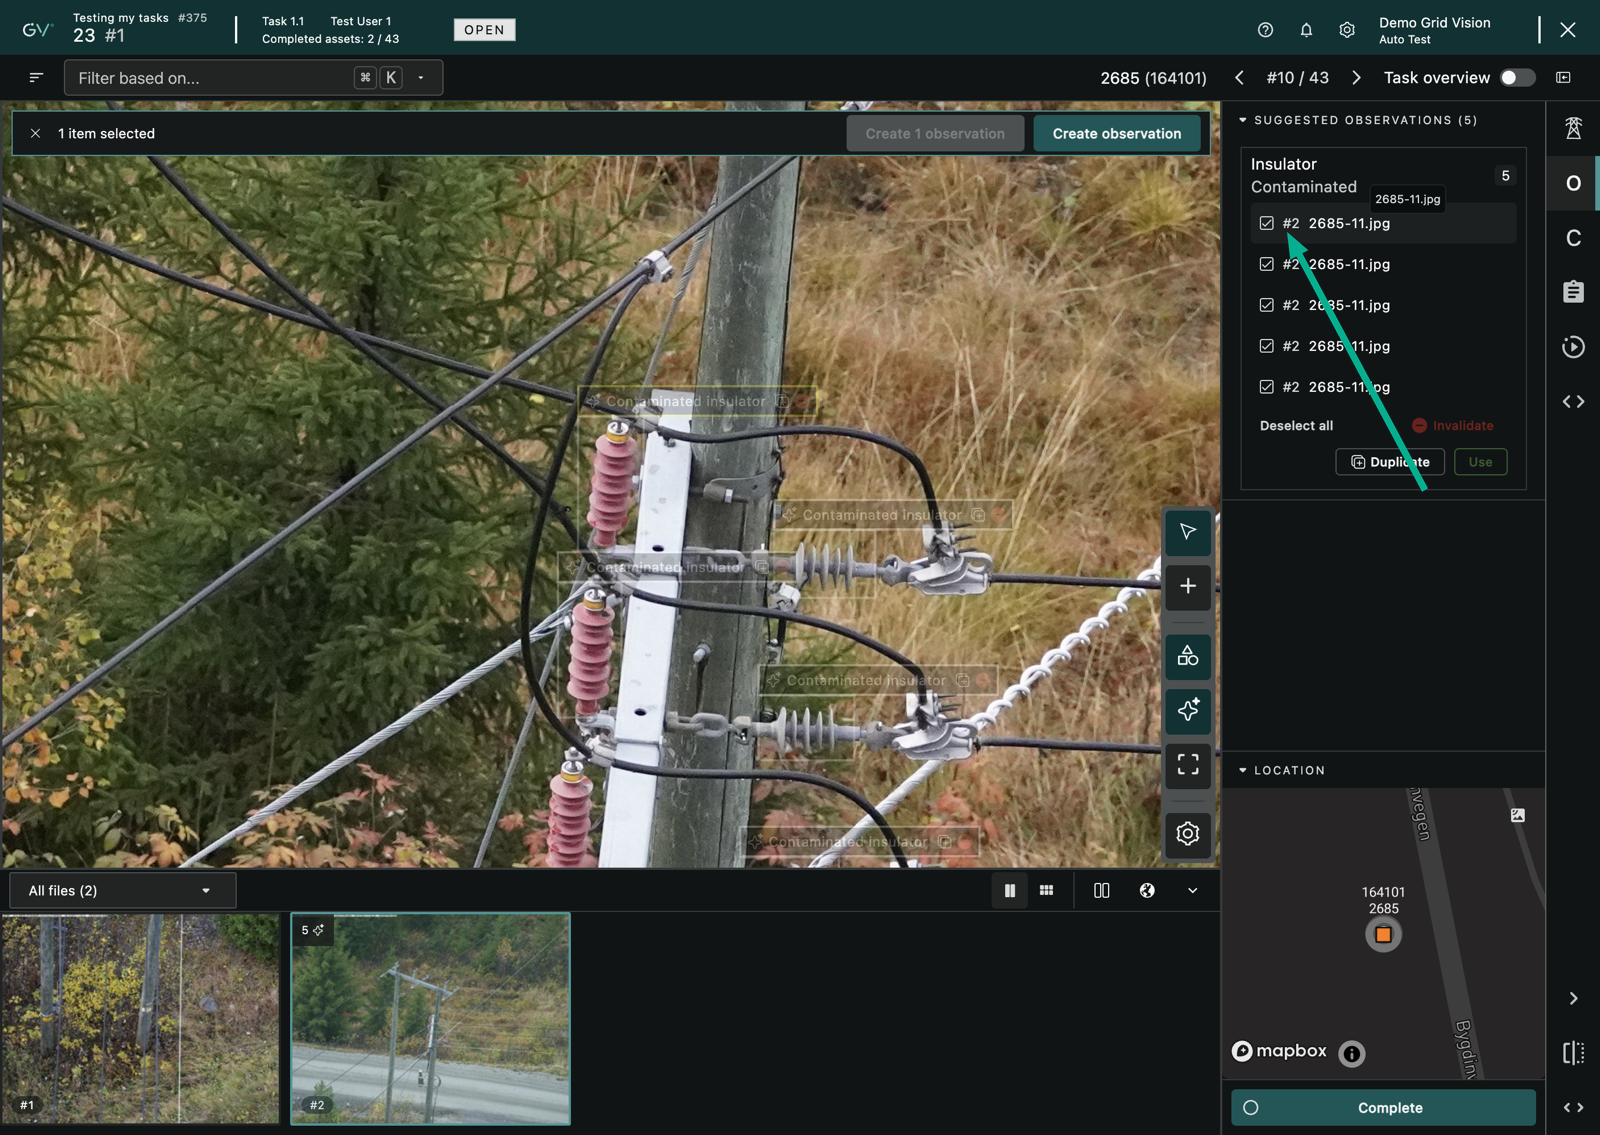
When the AI has suggested several defects on a file, you can act on many at once with the on-image multi-select mode instead of handling them one by one.
-
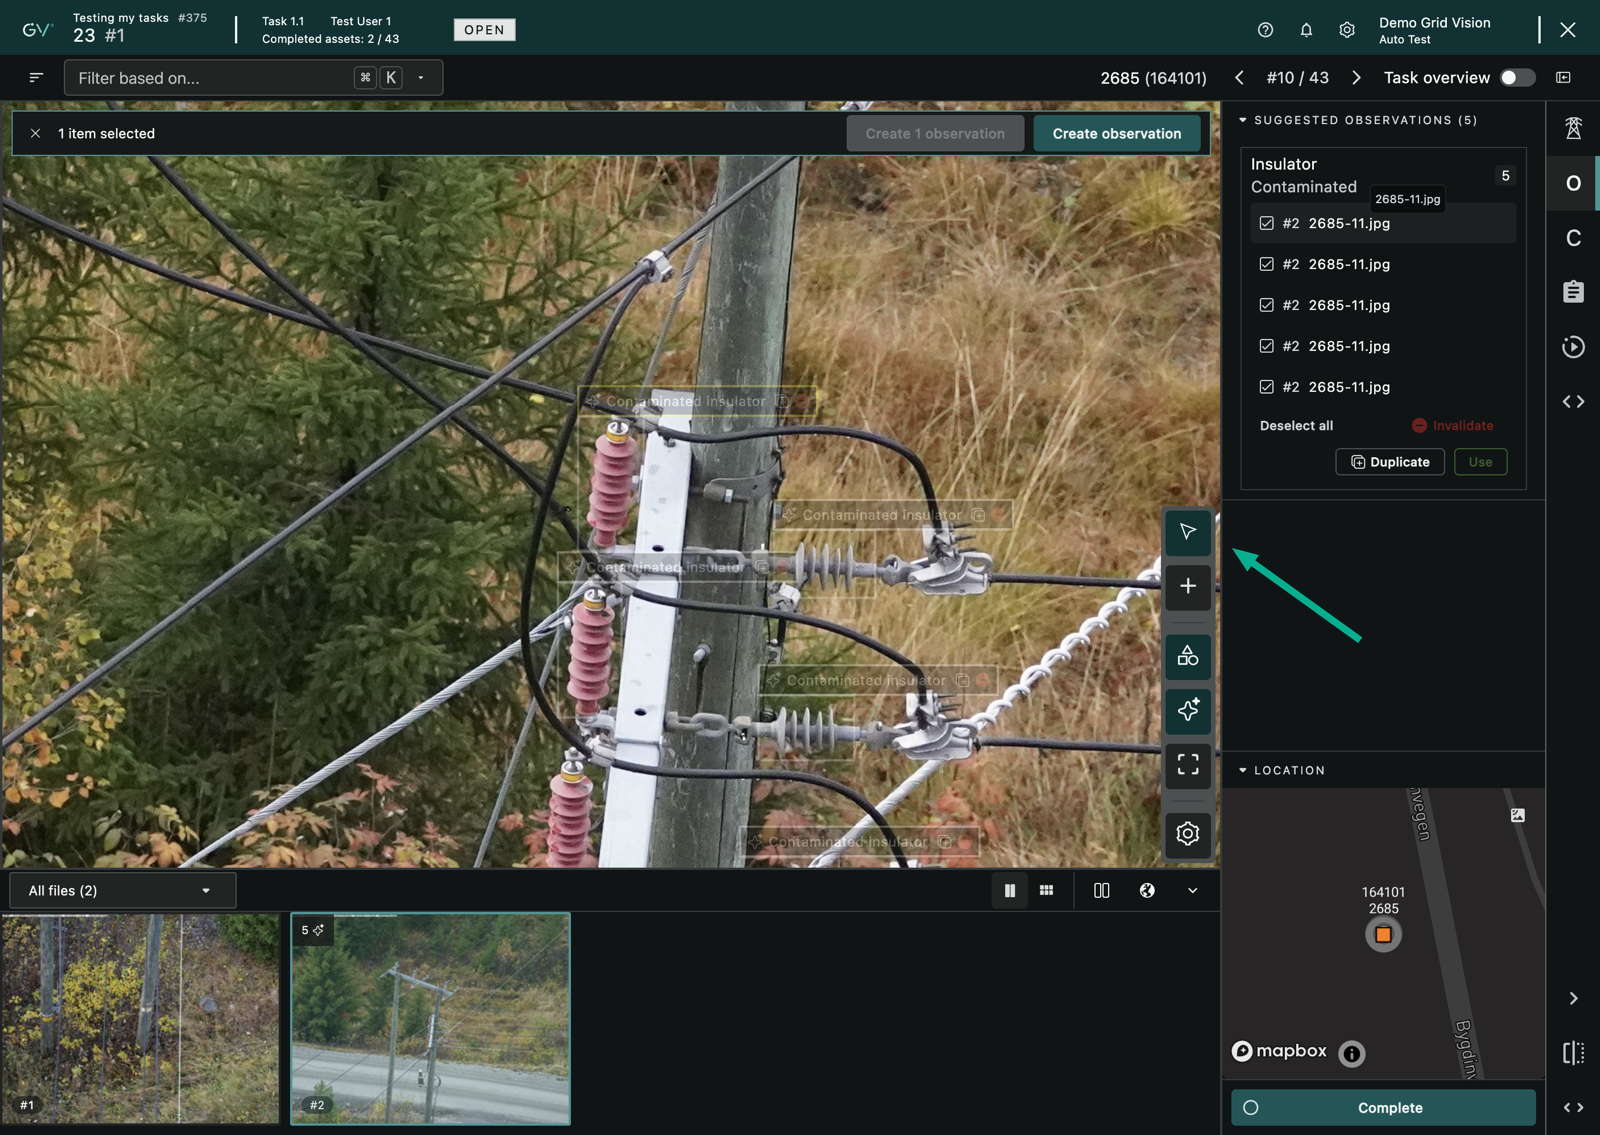
Turn on multi-select with the Multi-select observations toggle on the image toolbar, or Shift+click a suggestion on the image, which switches multi-select on so your next plain clicks keep adding to the selection instead of replacing it.
-
Shift+click each suggestion you want to include. Selected boxes stay highlighted together, and suggestions of a non-matching type dim so the ones you are collecting stand out. You can include boxes you draw yourself in the same selection.
-
On the selection banner, choose what to make. Create N observations creates a separate observation for each selected item, where N is the number selected. Create 1 observation merges the selected suggestions into a single observation backed by all of their images, and is enabled once two or more are selected.
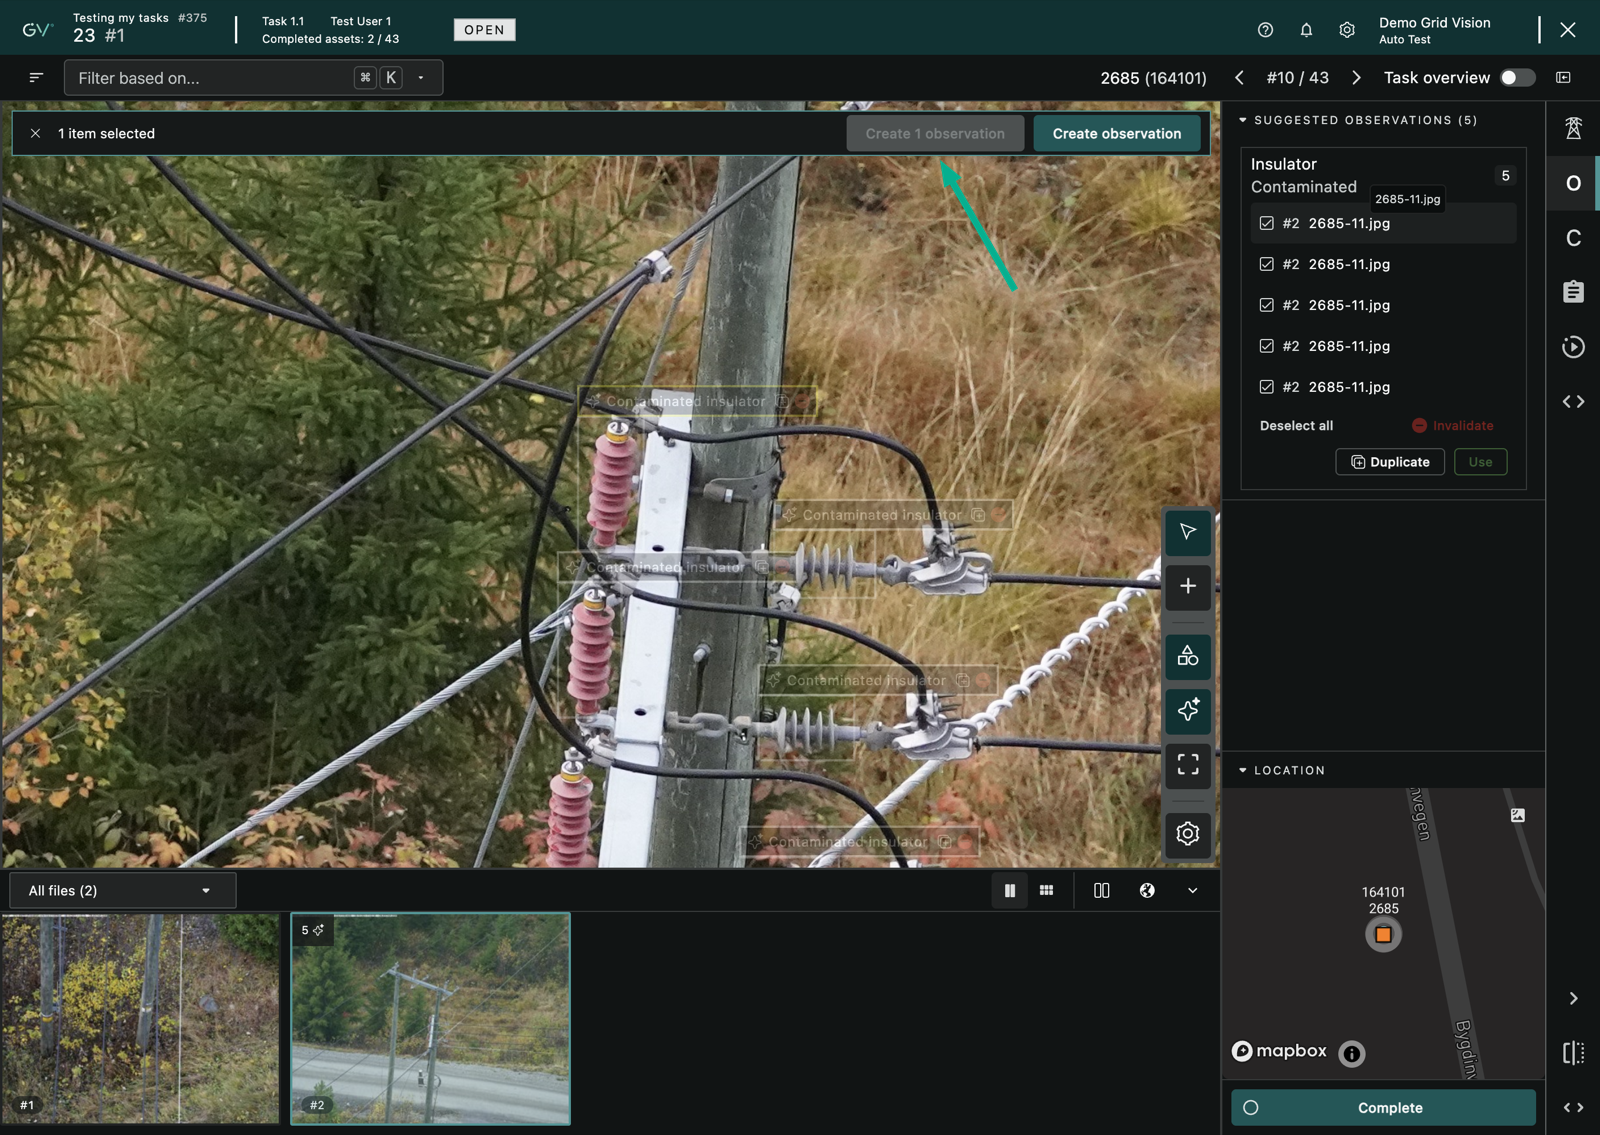
To attach a single suggestion to an observation that already exists rather than creating a new one, see AI suggestions.
Bounding box controls and edit mode
In Inspect, every observation is anchored to the image by a bounding box that frames the defect. You draw a box to create an observation, and you move, resize, or remove a box when you edit the observation it belongs to. The image toolbar runs down the side of the viewer and holds the drawing tool together with the controls you use while you annotate.
The image toolbar
The image toolbar sits beside the image and stays with you while you work. From the top it offers the Multi-select observations toggle, the Create observation tool that draws a bounding box, and, after a divider, the visibility toggles for observations, observation suggestions and components. On a thermal image an extra click-to-read toggle appears. A final Annotation settings button lets you choose how hidden boxes are revealed. The toolbar is active when you have permission to edit the task; on a task you can only view, such as one that is completed or under quality assurance, the drawing tool is not available and you work with the image in read-only mode, though the visibility toggles stay usable.
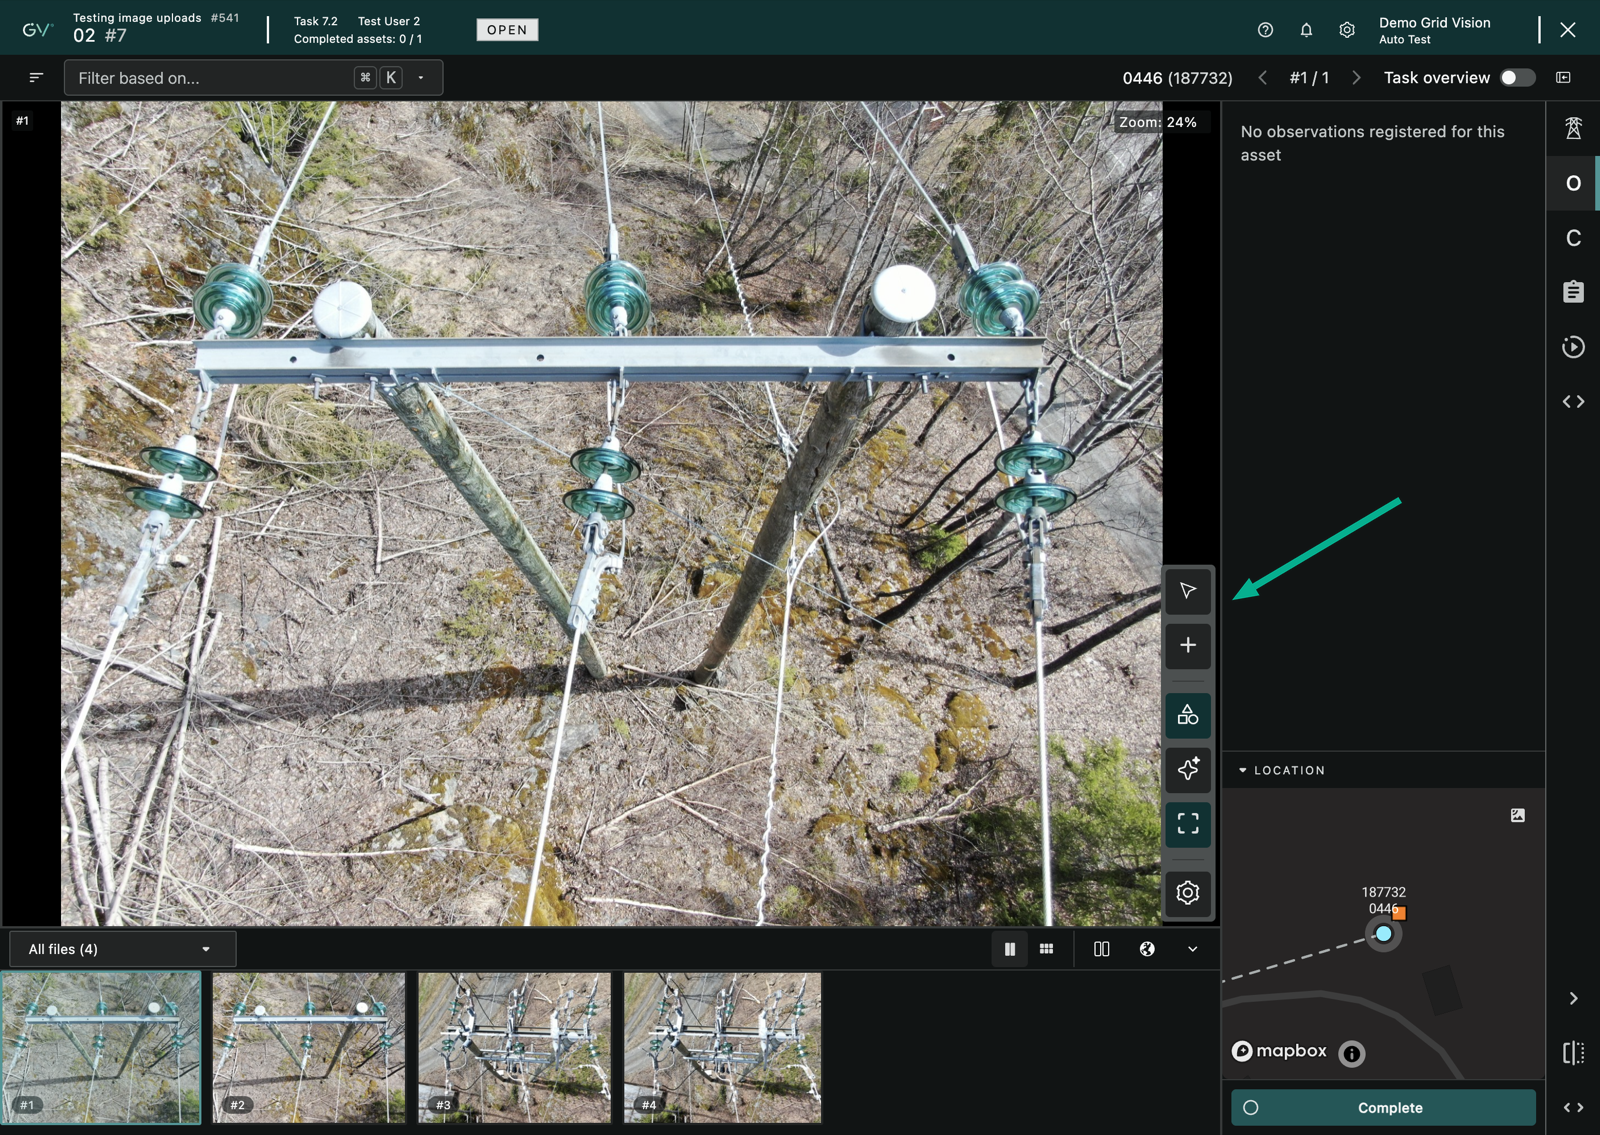
Steps to draw a bounding box
- Open the asset in Inspect and select the image you want to annotate.
- Click the Create observation tool on the image toolbar.
- Move the pointer over the image, then press, hold and drag to draw a box around the defect.
- Release the pointer to finish the box. The observation form opens next to the box so you can choose the observation type and set its properties.
-
Ensure that the box frames the defect before you confirm. You can still adjust it while the form is open.
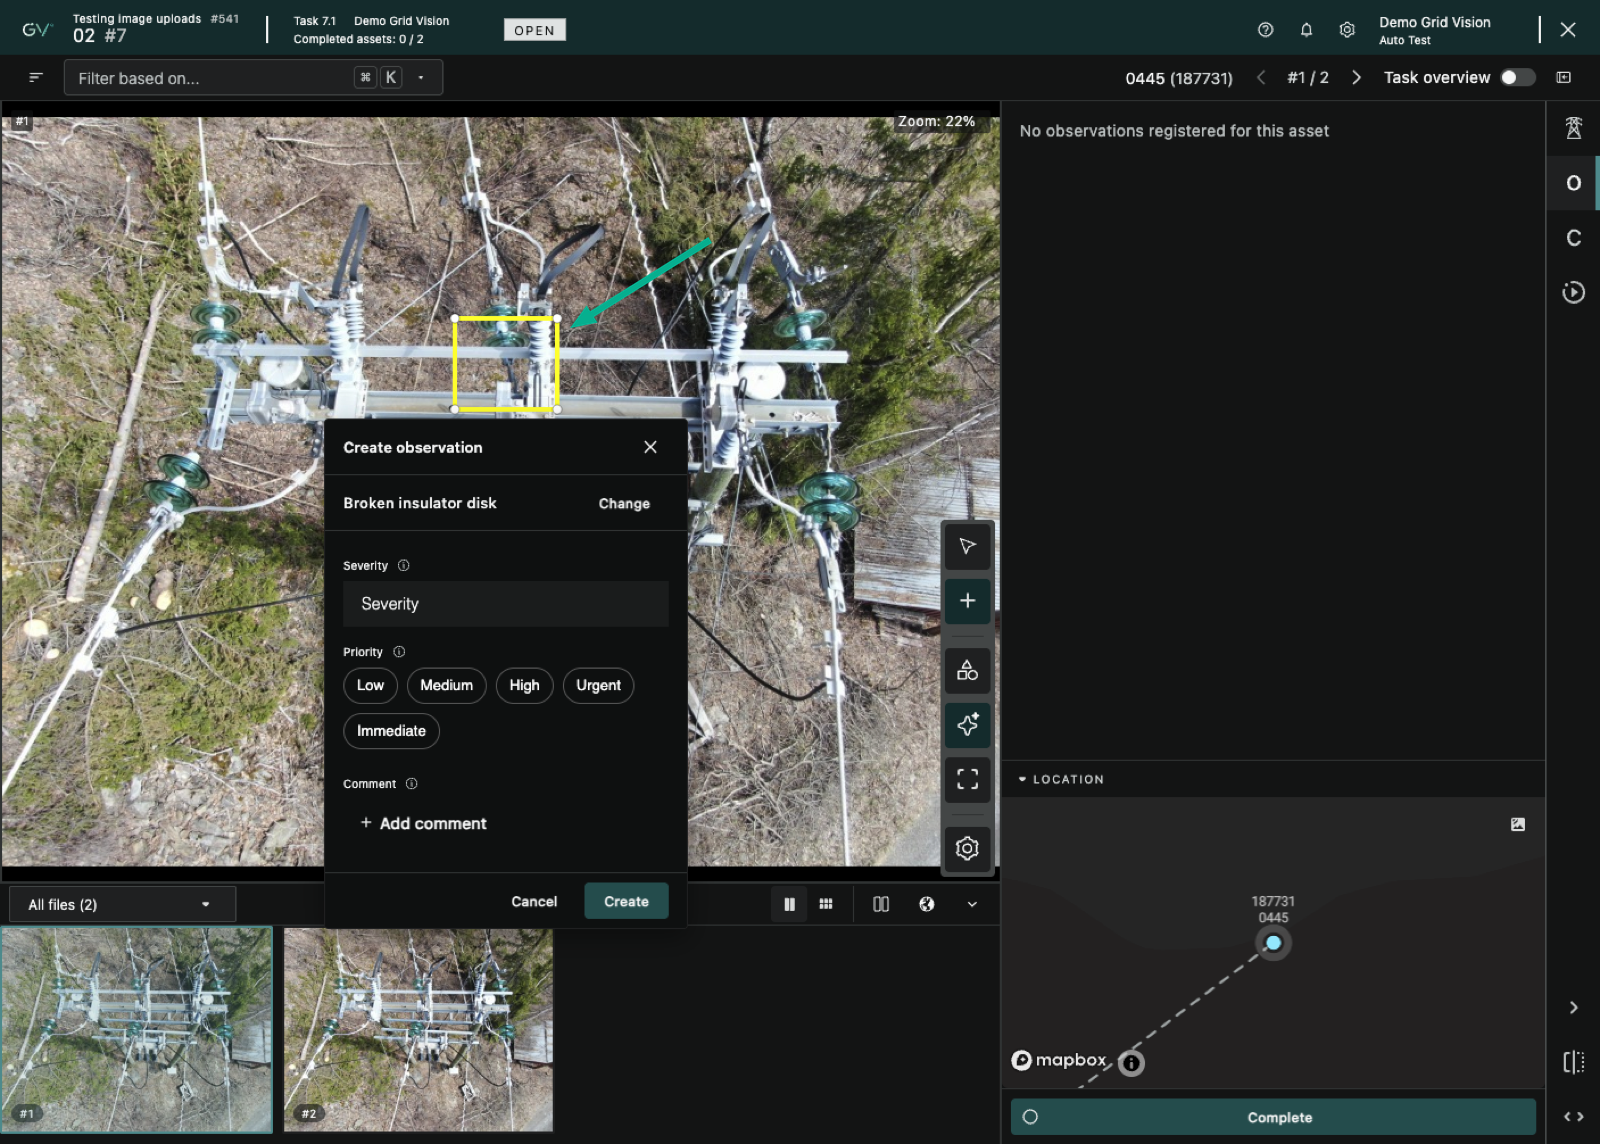
Steps to move or resize a bounding box
You can adjust the box on an observation you are editing. Select the observation first so it enters edit mode, then work with its box directly on the image.
- Select the observation on the image, or select it in the Observations list in the side panel.
- Drag inside the box to move it to a new position.
- Drag one of the handles on the corners or edges of the box to resize it.
-
Ensure that the box still frames the defect, then save your changes.
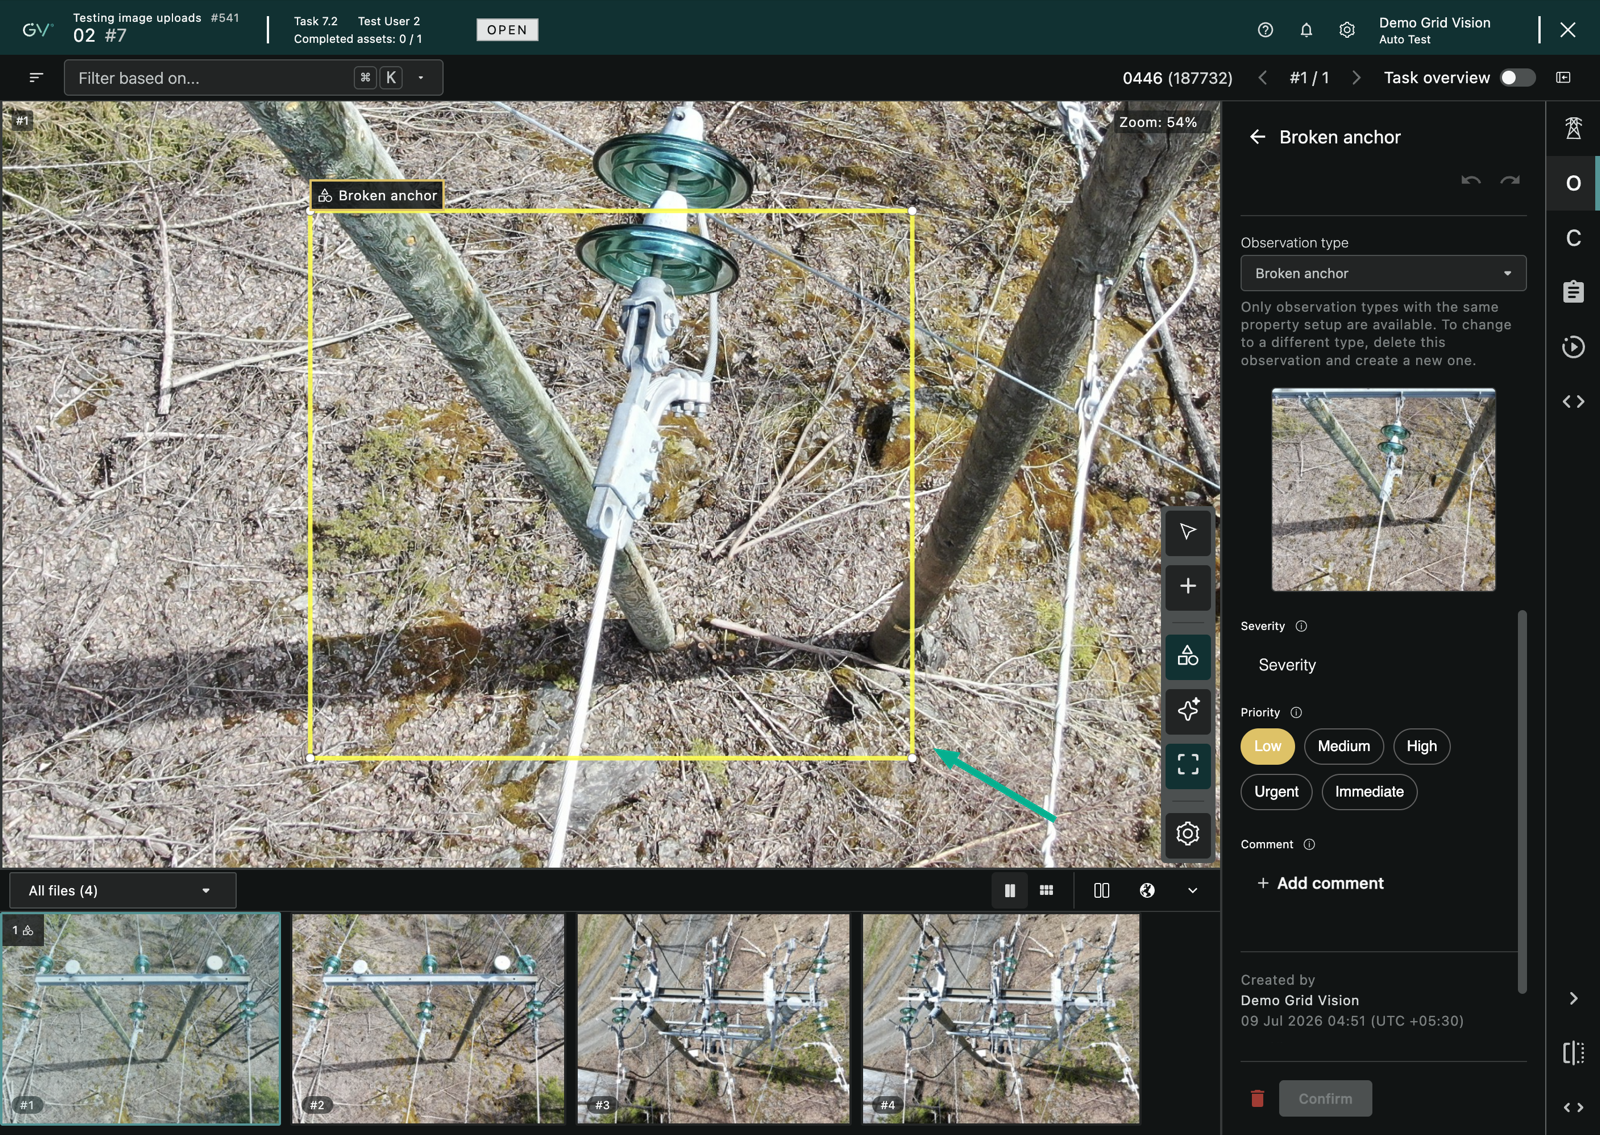
Edit mode
When you select a confirmed observation on a task you can edit, Inspect enters edit mode for that one observation. The observation form opens in the side panel, the box gains its drag handles, and every other observation and suggestion on the image is hidden so you can concentrate on the one you are working on. Leaving edit mode brings the other annotations back.
- Select an observation to open it for editing.
- Make your changes to the box or to the properties in the form.
- Save the observation to keep your changes, or press the Escape key to close the editor without keeping unsaved changes.
- Ensure that the other observations and suggestions reappear on the image once you leave edit mode.
If you try to switch to a different observation or suggestion while you have unsaved changes, Inspect asks you to confirm before it discards them.
Zooming around a bounding box
Selecting an observation or a suggestion zooms the image to that box, with a little space left around it so you can see the surrounding area. This makes it easy to move from the list to the exact spot on the image without panning by hand. Press the Home key at any time to fit the whole image back into the viewer.
Steps to remove a bounding box
You remove a box by deleting the observation it belongs to.
- Select the observation on the image.
- Press the Delete key.
- Confirm the deletion in the pop-up that appears. It is titled Delete observation and asks, "Are you sure you want to delete this observation? This action cannot be undone."
If you are still drawing a new box and have not confirmed it yet, pressing the Delete key simply cancels it and clears the form.
AI suggestions
Grid Vision's AI proposes possible defects as suggestions on an asset's media. Your job in Inspect is to review each suggestion and decide what it is: a real observation, a duplicate, or a false positive. Nothing you decide is thrown away, invalidated and duplicate suggestions stay on the record so you always know what the AI proposed and what you did with it.
Where suggestions appear
- On the image, AI suggestions are drawn as bounding boxes.
- In the side panel, the suggestions list (titled Suggested observations) shows every suggestion for the current file.
-
Selecting a suggestion in the list highlights it on the image and zooms to it, so it is easy to find.
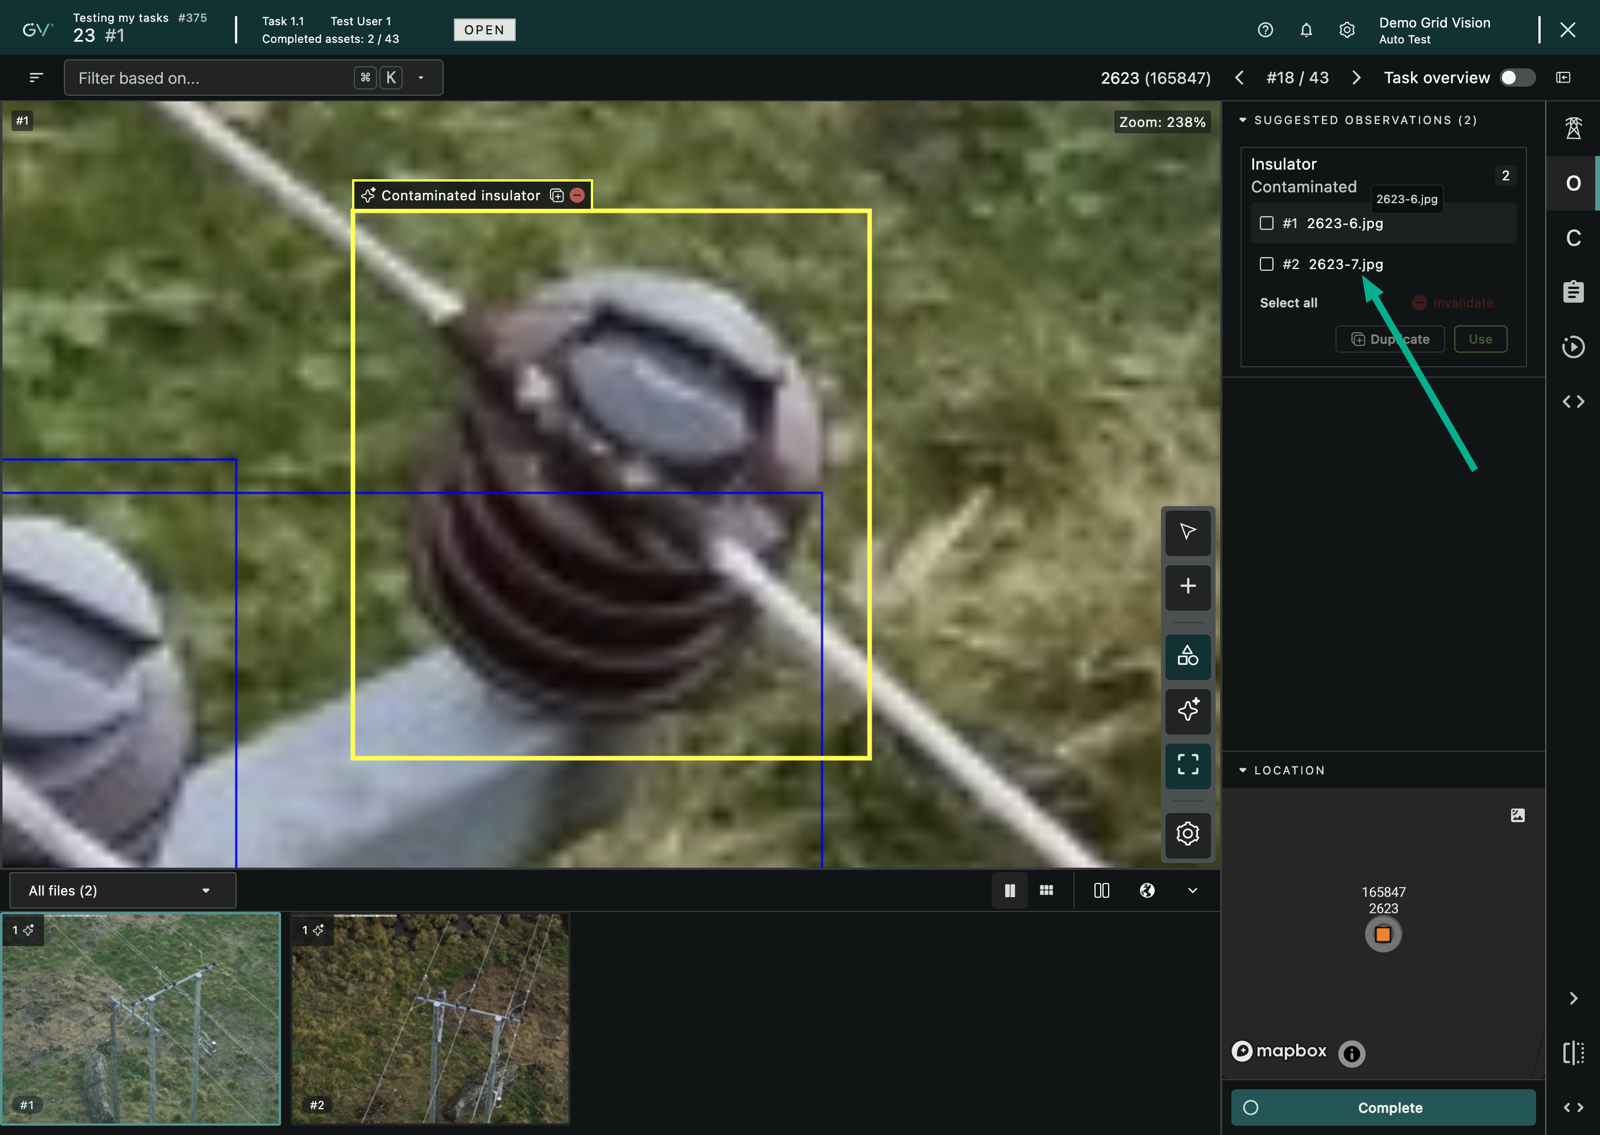
The suggestions list carries its own actions: Select all, Invalidate, Duplicate, and Use. Use turns a single selected suggestion into an observation and is enabled only when exactly one suggestion is selected, while Invalidate and Duplicate can act on several selected suggestions at once. This list is separate from the on-image multi-select mode described in Creating an observation, which is how you merge several suggestions into one observation; the two ways of selecting suggestions work independently of each other.
Steps to validate a suggestion
Validating a suggestion turns it into a confirmed observation.
- Select the suggestion in the suggestions list, or click its box on the image.
- Click Use. The observation form opens.
- Choose the observation type, set its severity, priority and any other properties, then click Create.
- Ensure that the suggestion becomes a confirmed observation on the asset.
To validate several suggestions at once, use the on-image multi-select mode described in Creating an observation.
Steps to add a suggestion to an existing observation
When the AI has flagged another view of a defect you have already recorded, you can attach the suggestion to that observation instead of creating a new one, so both views live on the same record.
- Select the suggestion and click Use to open the observation form.
- If a confirmed observation of the same type already exists, a Duplicate button appears beside Create. Click Duplicate.
- In the Add to existing observation picker, choose the observation you want from the list of matching confirmed observations. The picker notes, "Only confirmed observations of the same type appear here. Selecting one adds this suggestion to it as a new proof."
-
Click Add to attach the suggestion to that observation as another proof.
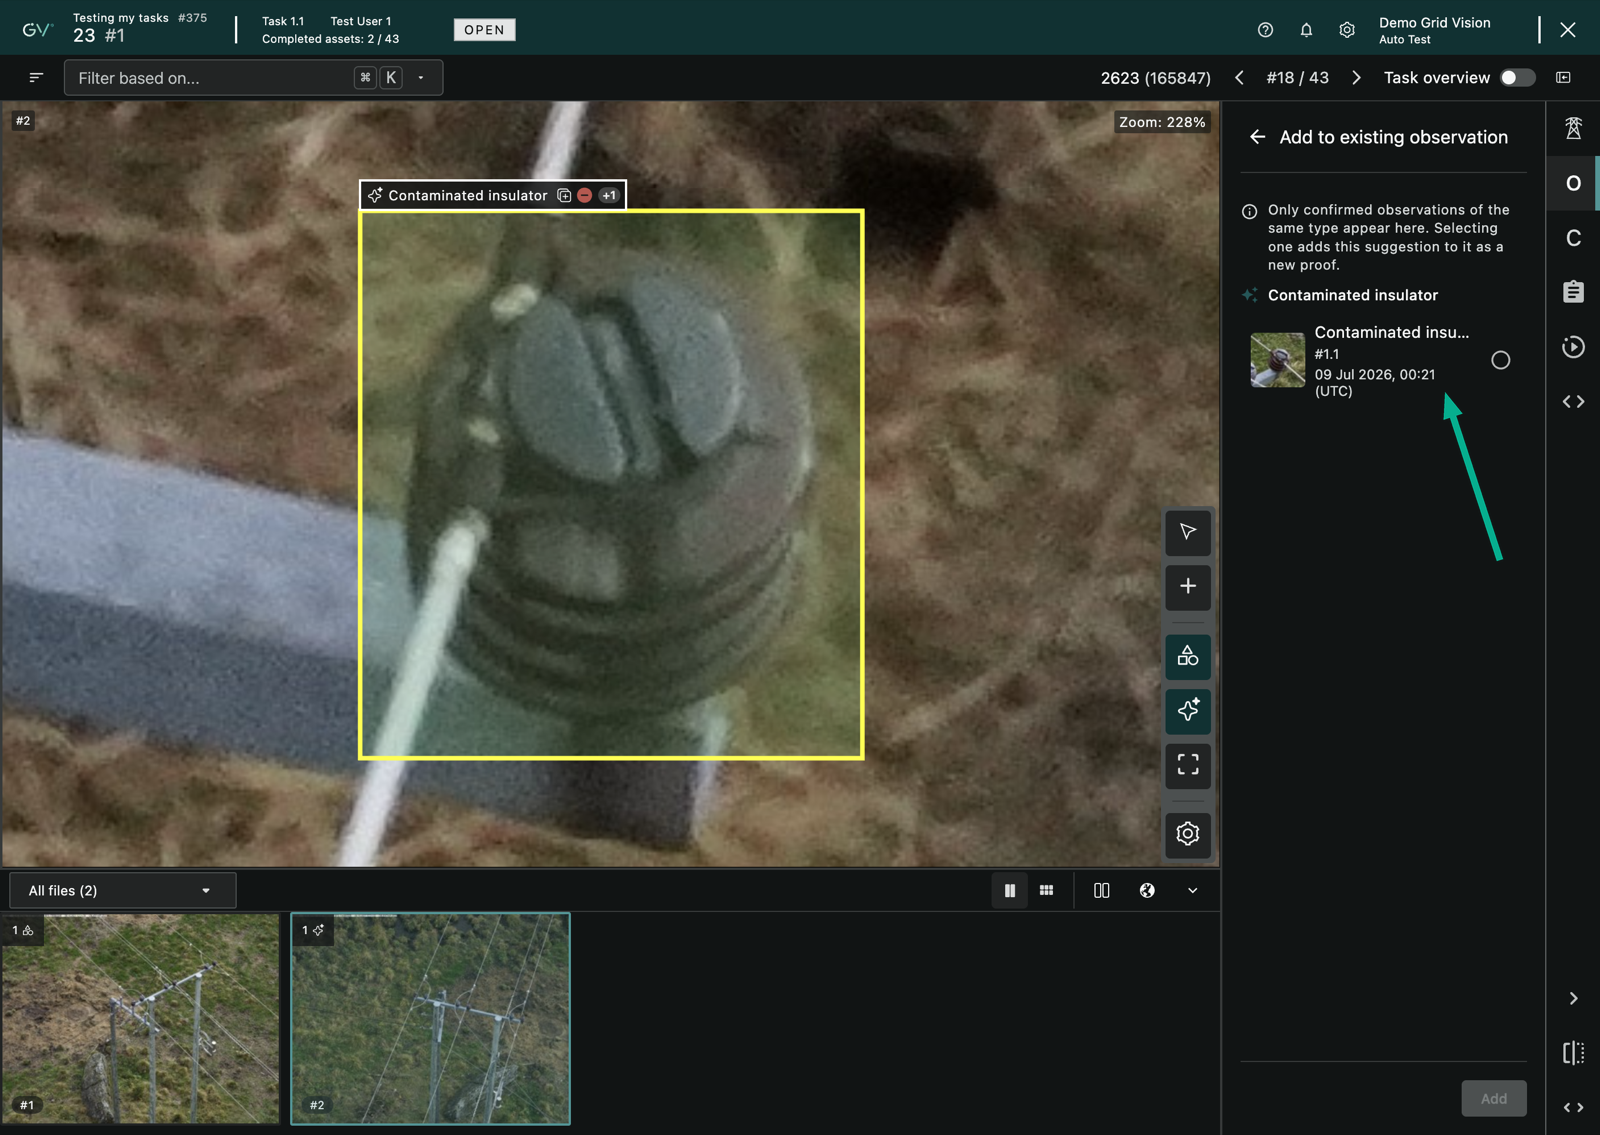
The Duplicate button in the observation form is not the same as the ⊕ icon on a suggestion's on-image label. That inline icon marks the suggestion itself as a duplicate, described next.
Mark a suggestion as a duplicate
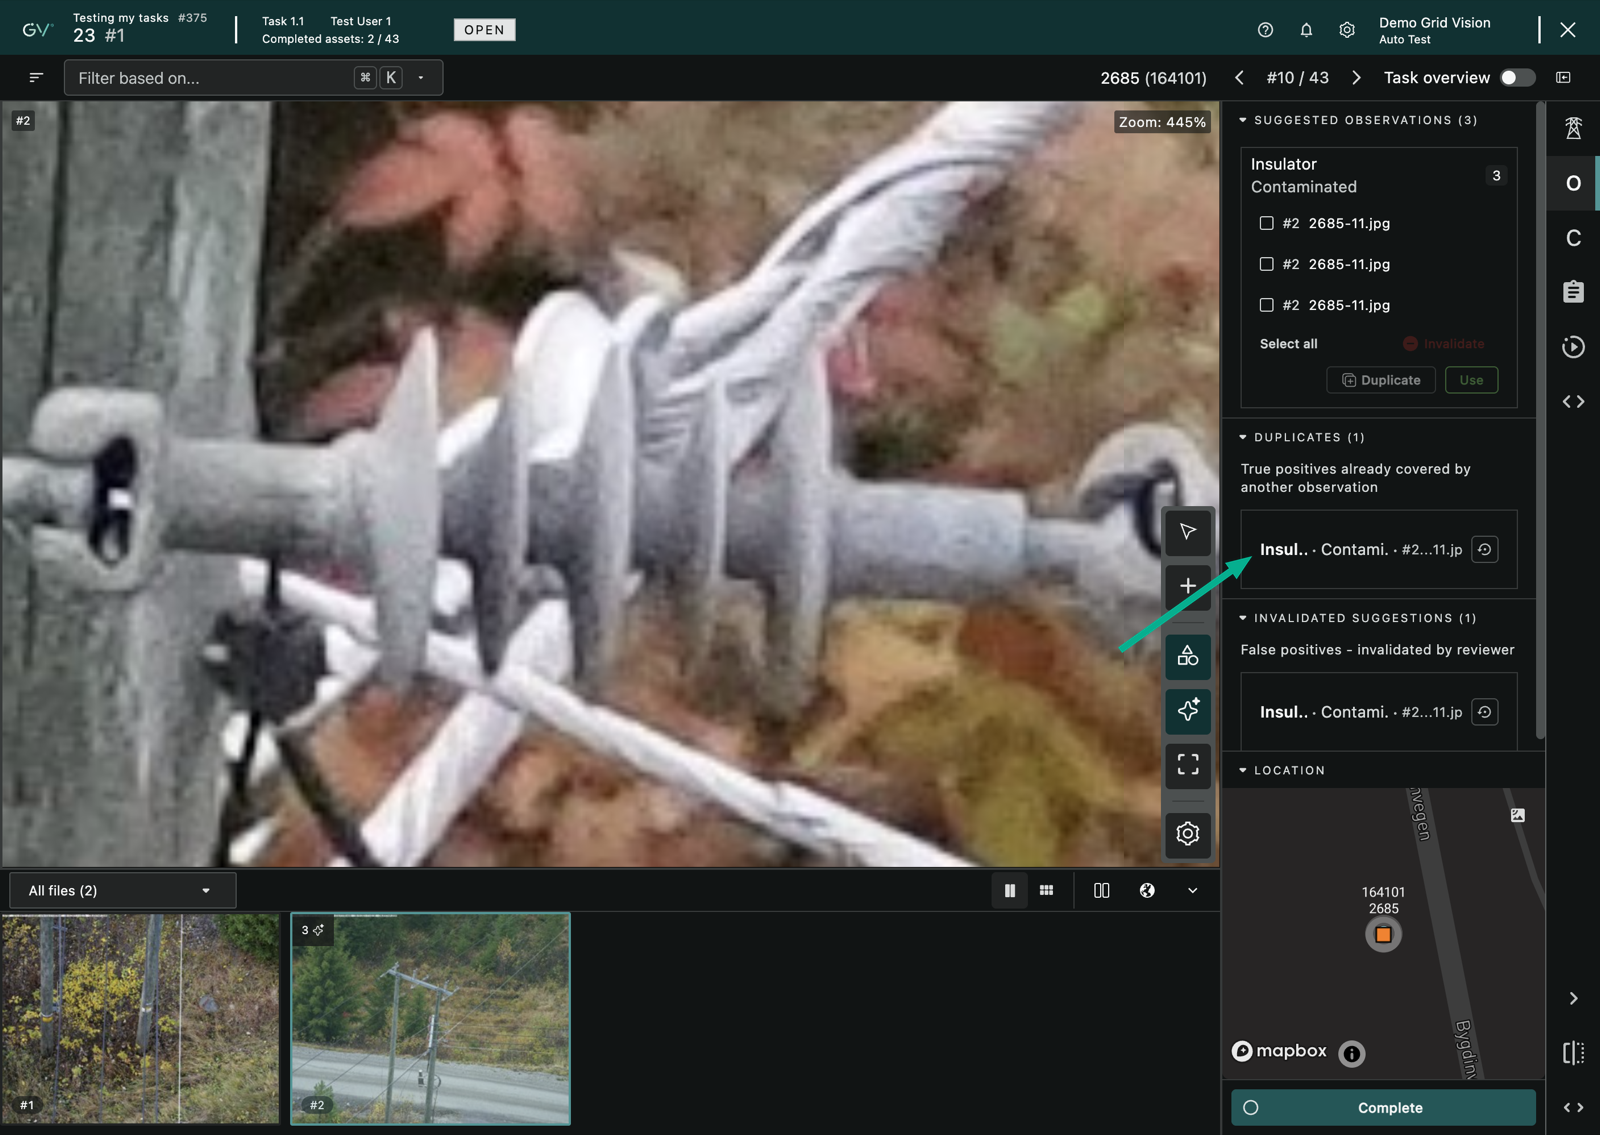
When a suggestion describes a defect that is already covered by another observation, mark it as a duplicate with the Duplicate action in the suggestions list. The suggestion moves into a Duplicates section, labelled "True positives already covered by another observation", and stays there with a restore control so you can bring it back. Nothing is deleted, and the action takes effect immediately without a confirmation pop-up.
Invalidate a suggestion
If a suggestion is not a real defect, invalidate it as a false positive.
- Select the suggestion in the suggestions list, or click its box on the image.
- Click Invalidate.
-
Ensure that the suggestion moves into an Invalidated suggestions section, labelled "False positives - invalidated by reviewer".
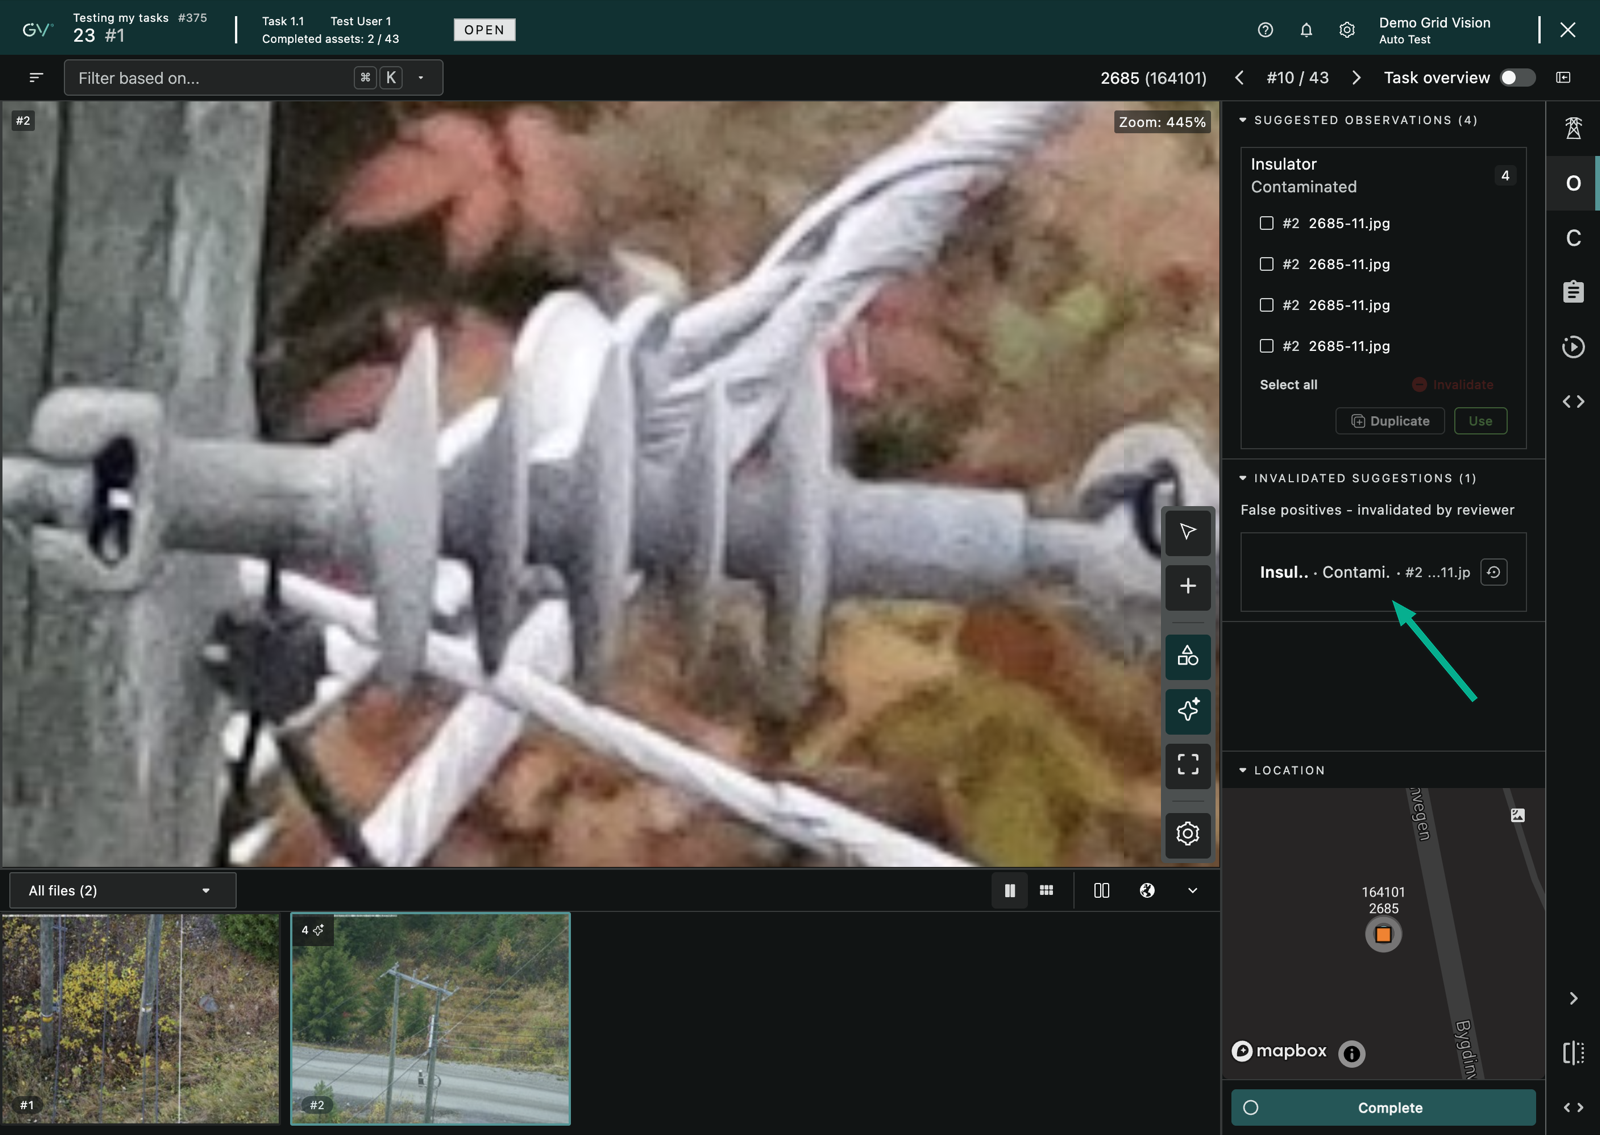
Invalidated and duplicate suggestions are kept off the main review flow but remain on the record with a restore control, so nothing the AI proposed is ever lost.
Multi-image observations
The same defect is often visible in more than one image. A multi-image observation is a single observation backed by several images, so you record the defect once and keep every view of it together instead of creating a separate observation for each image.
Steps to create a multi-image observation
- On the file, turn on multi-select and select two or more suggestions that show the same defect, as described in Creating an observation.
- Click Create 1 observation. This is enabled once two or more suggestions are selected.
-
Ensure that the selected suggestions merge into a single observation whose images are all the selected proofs.
Review the images on an observation
When you open a multi-image observation for editing, the edit form shows every image behind it so you can check the full evidence for one defect without leaving the form.
- Use the previous and next arrows on the thumbnail card to move between the images.
- Ensure that the card shows which image you are on.
-
Use the download action to save the image you are viewing.
The crop gallery
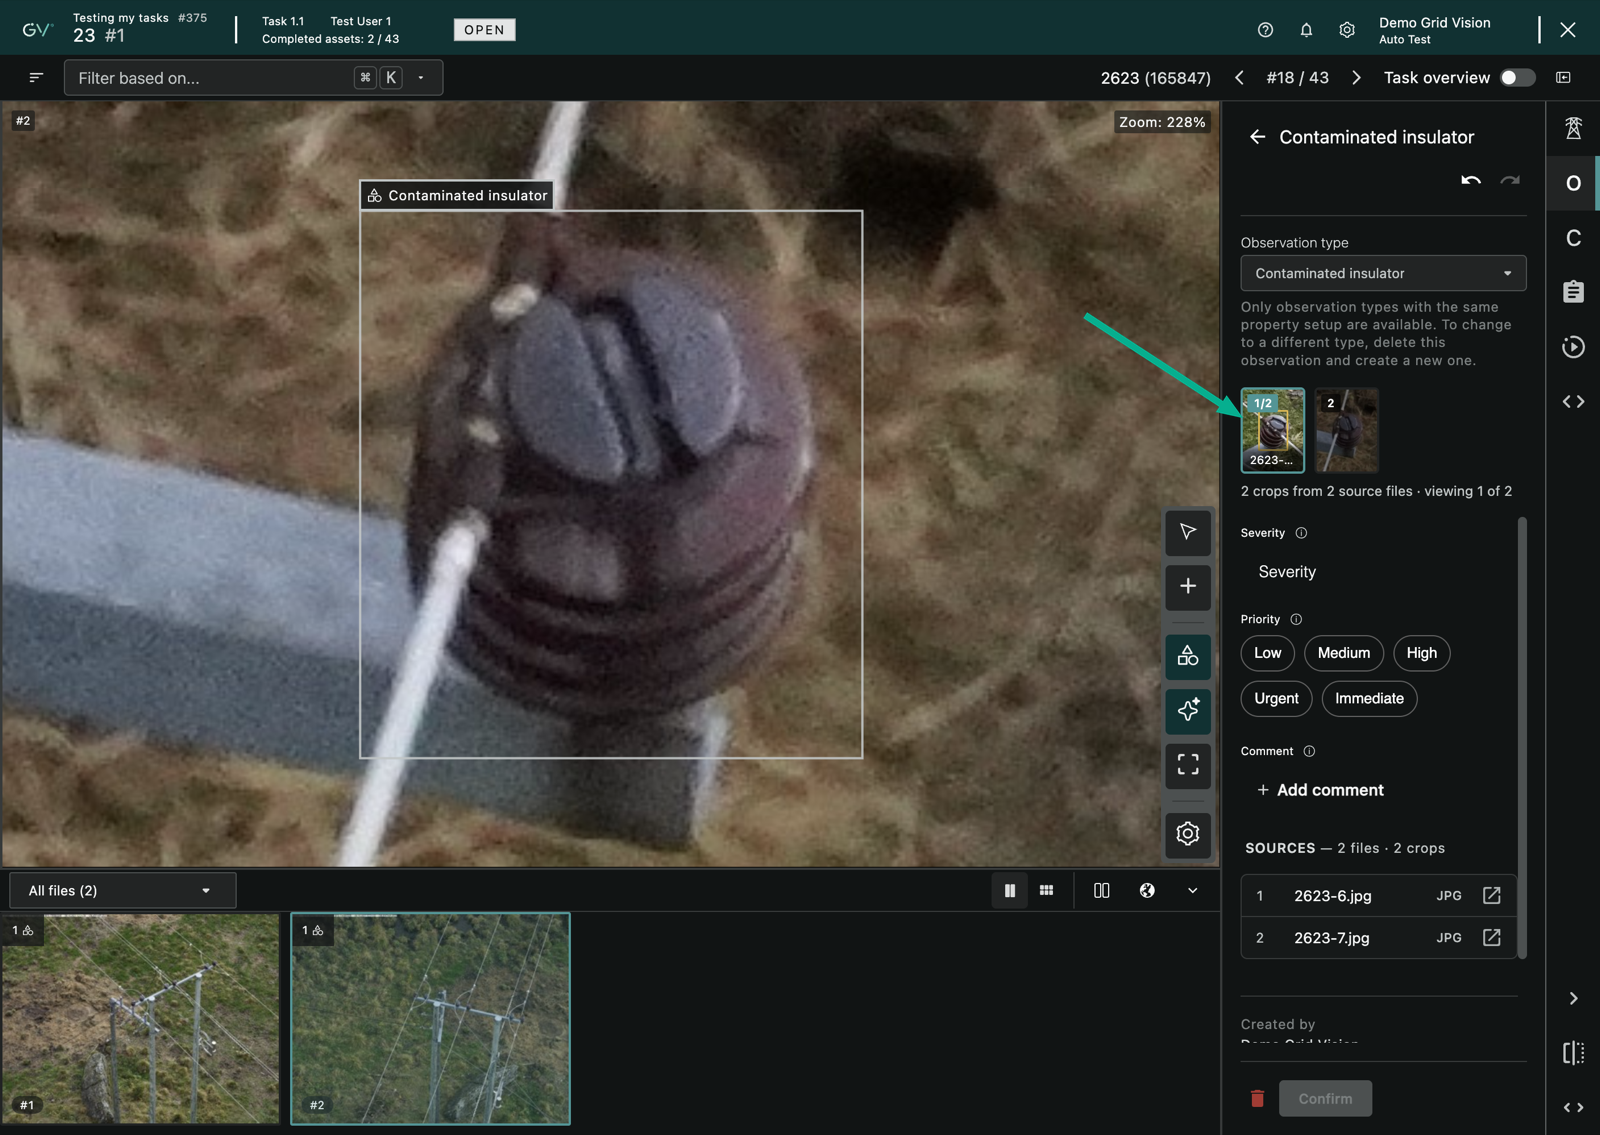
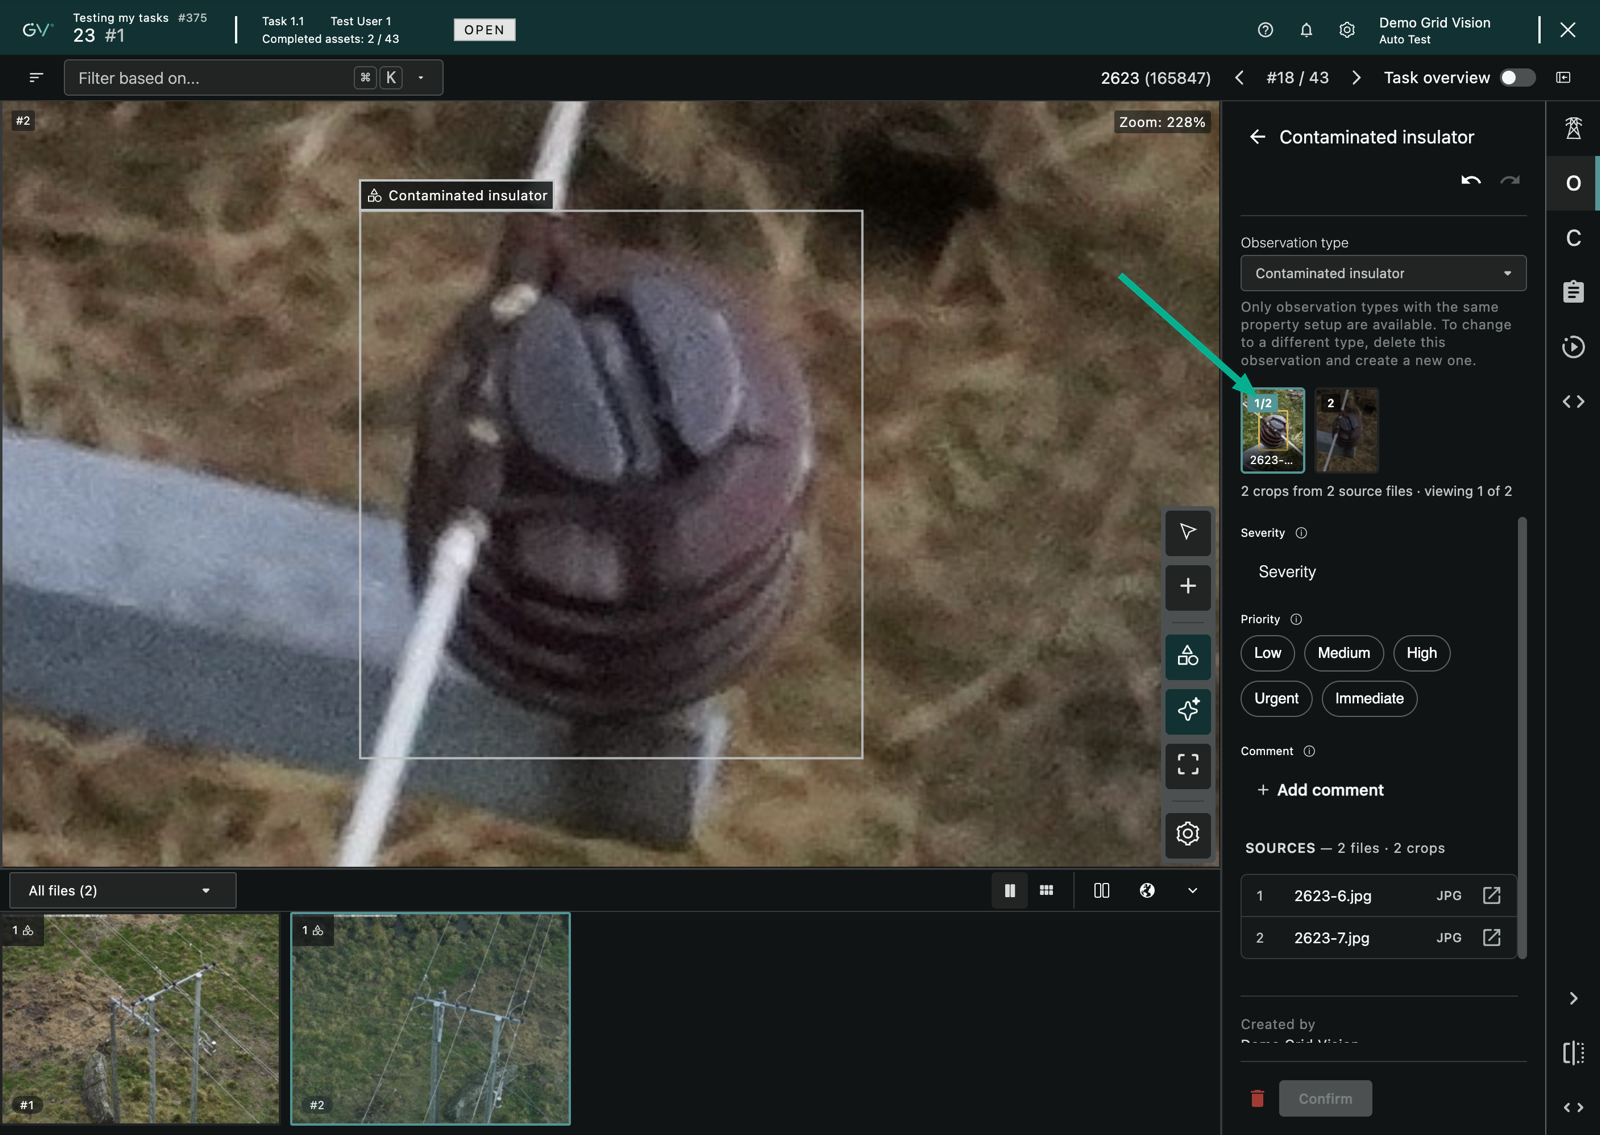
Above the observation form, a strip of square tiles shows each bounding box, or crop, behind the observation. Four tiles are visible at a time, and side arrows page through the rest when there are more. The tile you are viewing has a teal border, shows its box drawn inside the thumbnail, and shows its source filename; the other tiles are dimmed and show their filename when you hover over them. A caption below the strip keeps count, reading how many crops the observation has, how many source files they come from, and which one you are viewing, for example "2 crops from 2 source files · viewing 1 of 2".
- Click a tile to jump the main viewer to that crop's source file and centre it on the box.
-
Use the side arrows to page through the crops when there are more than four.
The Sources section
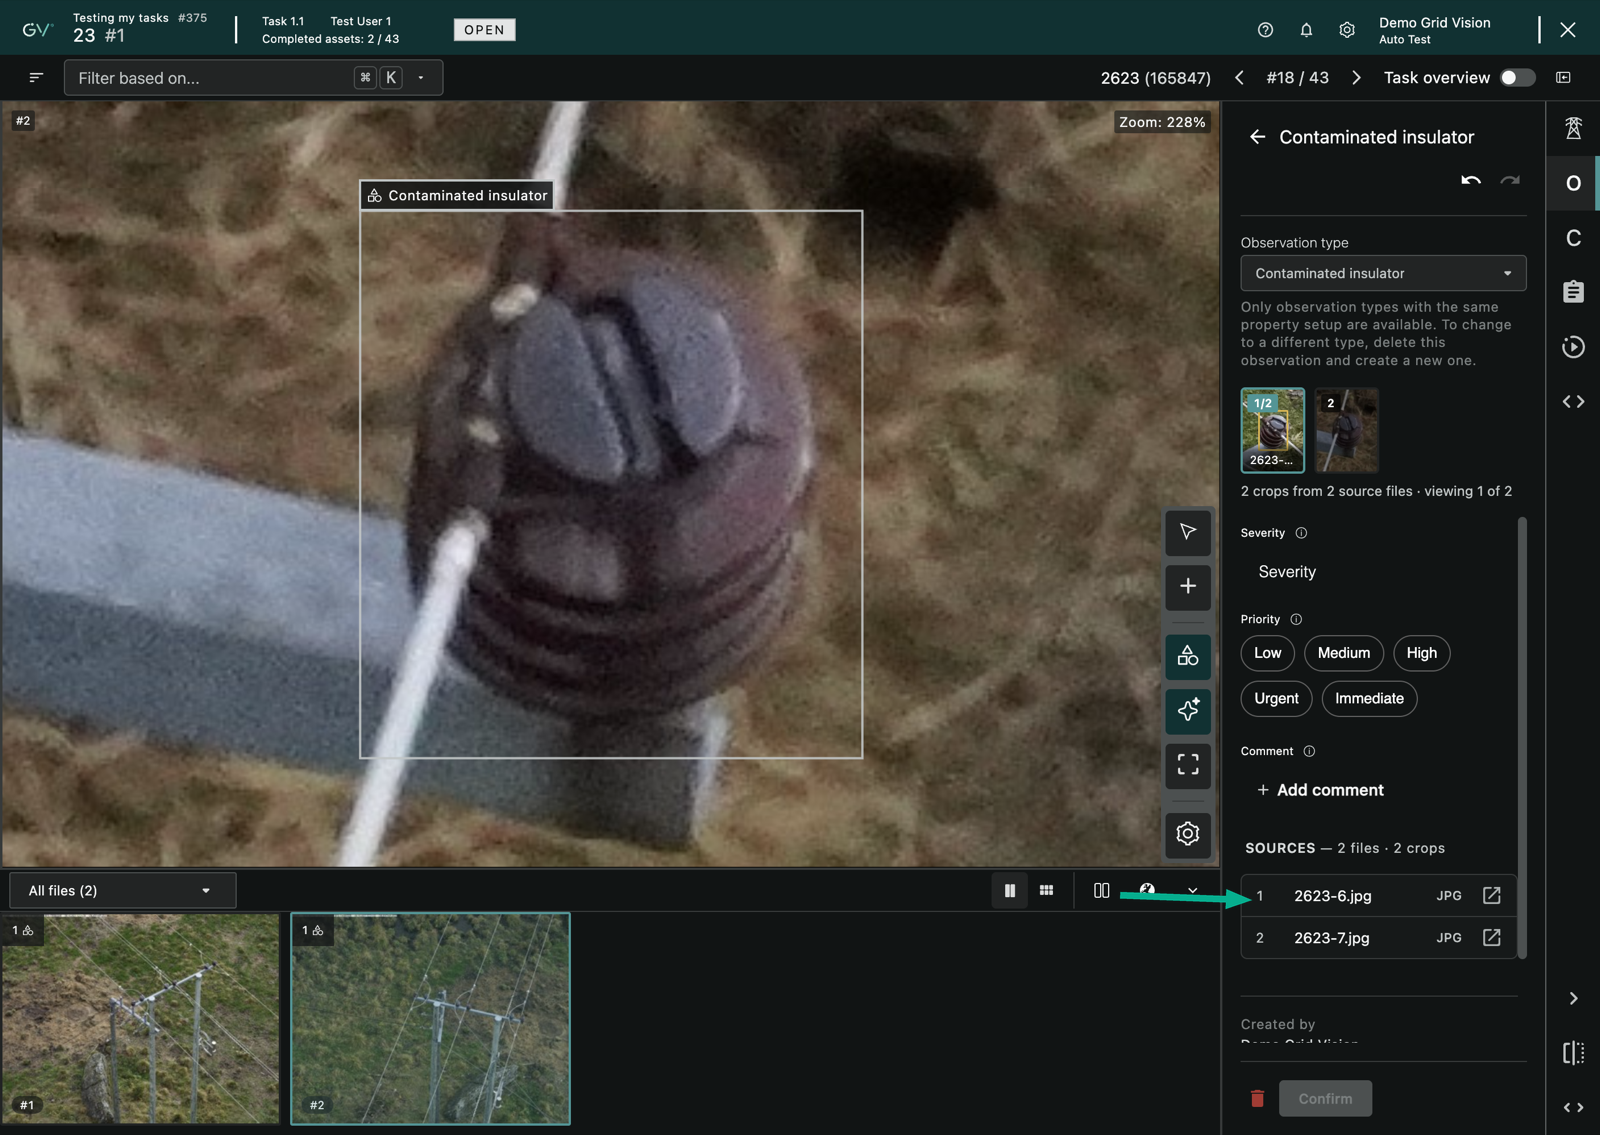
Below the form, a Sources section lists every distinct source file behind the observation, with a header that counts them, for example "SOURCES — 2 files · 2 crops". Each row is numbered and shows the filename, its file-type chip, and an icon to open the file in the viewer. A file that holds more than one crop carries a count so you can see it contributes several boxes.
-
Click a row to open that file in the main viewer.
Removing a crop
When an observation has more than one crop, you can drop one you no longer want from within the edit form. The last remaining crop cannot be removed, because an observation must keep at least one box; to remove the last one, delete the whole observation instead.
Multi-image observations in QA
During quality assurance, a multi-image observation's images are grouped into a single navigable card so a reviewer can check every view without leaving the observation. Previous and next controls step through the images, dot and count indicators show how many there are and which one is active, and a download-all action saves every image for the observation at once. The QA workflow itself is covered in the Work section.
Once a project group is approved, its multi-image observations carry all of their images through to Report and Grid Analytics as well. Each observation is shown there as a single card you can page through, and downloading from the card gives you every image for the observation, so no view is lost outside Inspect.
Show and hide observations
An inspection image can carry a lot at once: your confirmed observations, the observation suggestions the AI has proposed, and the component boxes it has detected. Inspect gives you visibility toggles so you can clear away what you are not working on and focus on the rest. The toggles change only what you see on the image, never the underlying data, and they apply to the image you are looking at.
Visibility toggles on the image toolbar
Three toggles on the image toolbar control what is drawn on the image. Each one switches its own layer on or off, and its icon shows the current state. The full toolbar is described in Bounding box controls and edit mode.
- Show observations hides or shows your confirmed observation boxes.
- Show observation suggestions hides or shows the defect suggestions the AI has proposed.
-
Show components hides or shows the detected component boxes. This is the master control for the components layer, so it turns every component type on or off at once.
The toggles stay usable even on a task you can only view, such as one that is completed or under quality assurance, where only the drawing tool is disabled.
Show or hide one component type at a time
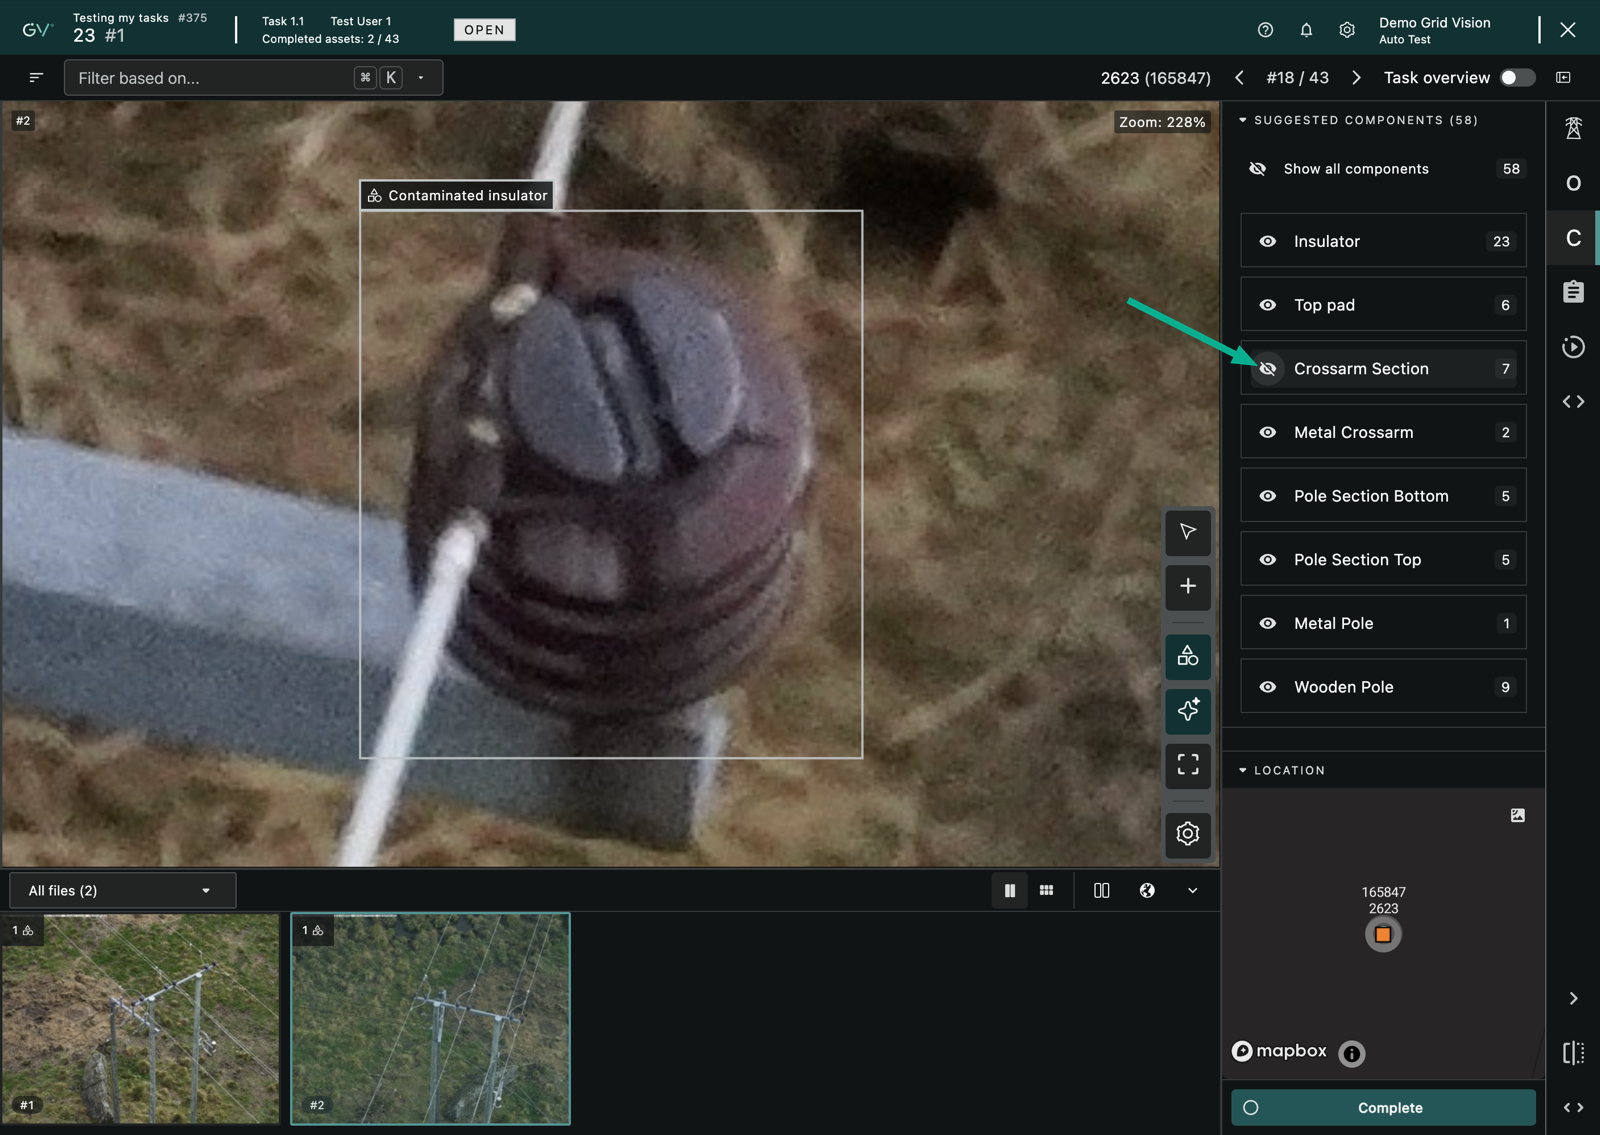
The Components tab in the side panel lists every component type detected on the image, titled Suggested components, each with a count of how many were found. Each row has its own eye icon, so you can hide a single type while keeping the rest.
- Open the Components tab in the side panel.
- Click the eye icon on a row to hide that component type. Click it again to show it.
- Click the eye icon on the Show all components row at the top to switch every type on or off together.
- Ensure that the Show all components row and the Show components toggle on the image toolbar stay in step, since they are the same control shown in two places.
When some types are on and others are off, clicking Show all components turns them all on.
Reveal hidden boxes without switching them back on
When you have hidden one or more component types, you can still take a quick look at what is underneath without turning them back on. Move the pointer over the image and the hidden boxes appear for as long as the pointer stays there; move away and they disappear again. This is a preview only, so it never changes your toggle settings, and you can still click a revealed box to create an observation from it.
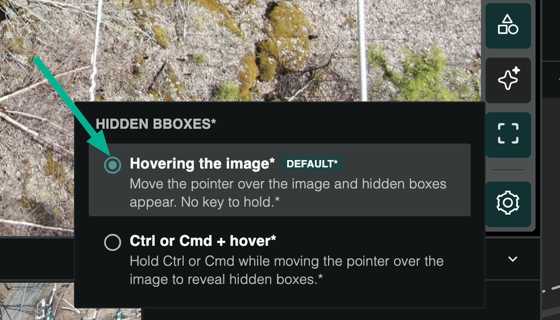
You choose how this reveal works from the Annotation settings button on the image toolbar, which offers two options for hidden boxes.
- Hovering the image shows hidden boxes whenever the pointer is over the image, with no key to hold. This is the default.
-
Ctrl or Cmd + hover shows hidden boxes only while you hold the Ctrl or Cmd key and move the pointer over the image.
What each state shows
Hiding a layer takes those boxes off the image but leaves everything intact. Your observations, suggestions and detected components are all still there, and switching the toggle back on brings them straight back. A selected observation stays reachable even when its layer is hidden, so moving to an observation from the list still takes you to it on the image.
Image appearance
Some defects are easier to spot once you adjust how the image looks. Inspect lets you tune the appearance of the image you are viewing without changing the original file, so you can bring out detail in a dark corner or flatten a harsh contrast while you inspect.
Steps to adjust the image
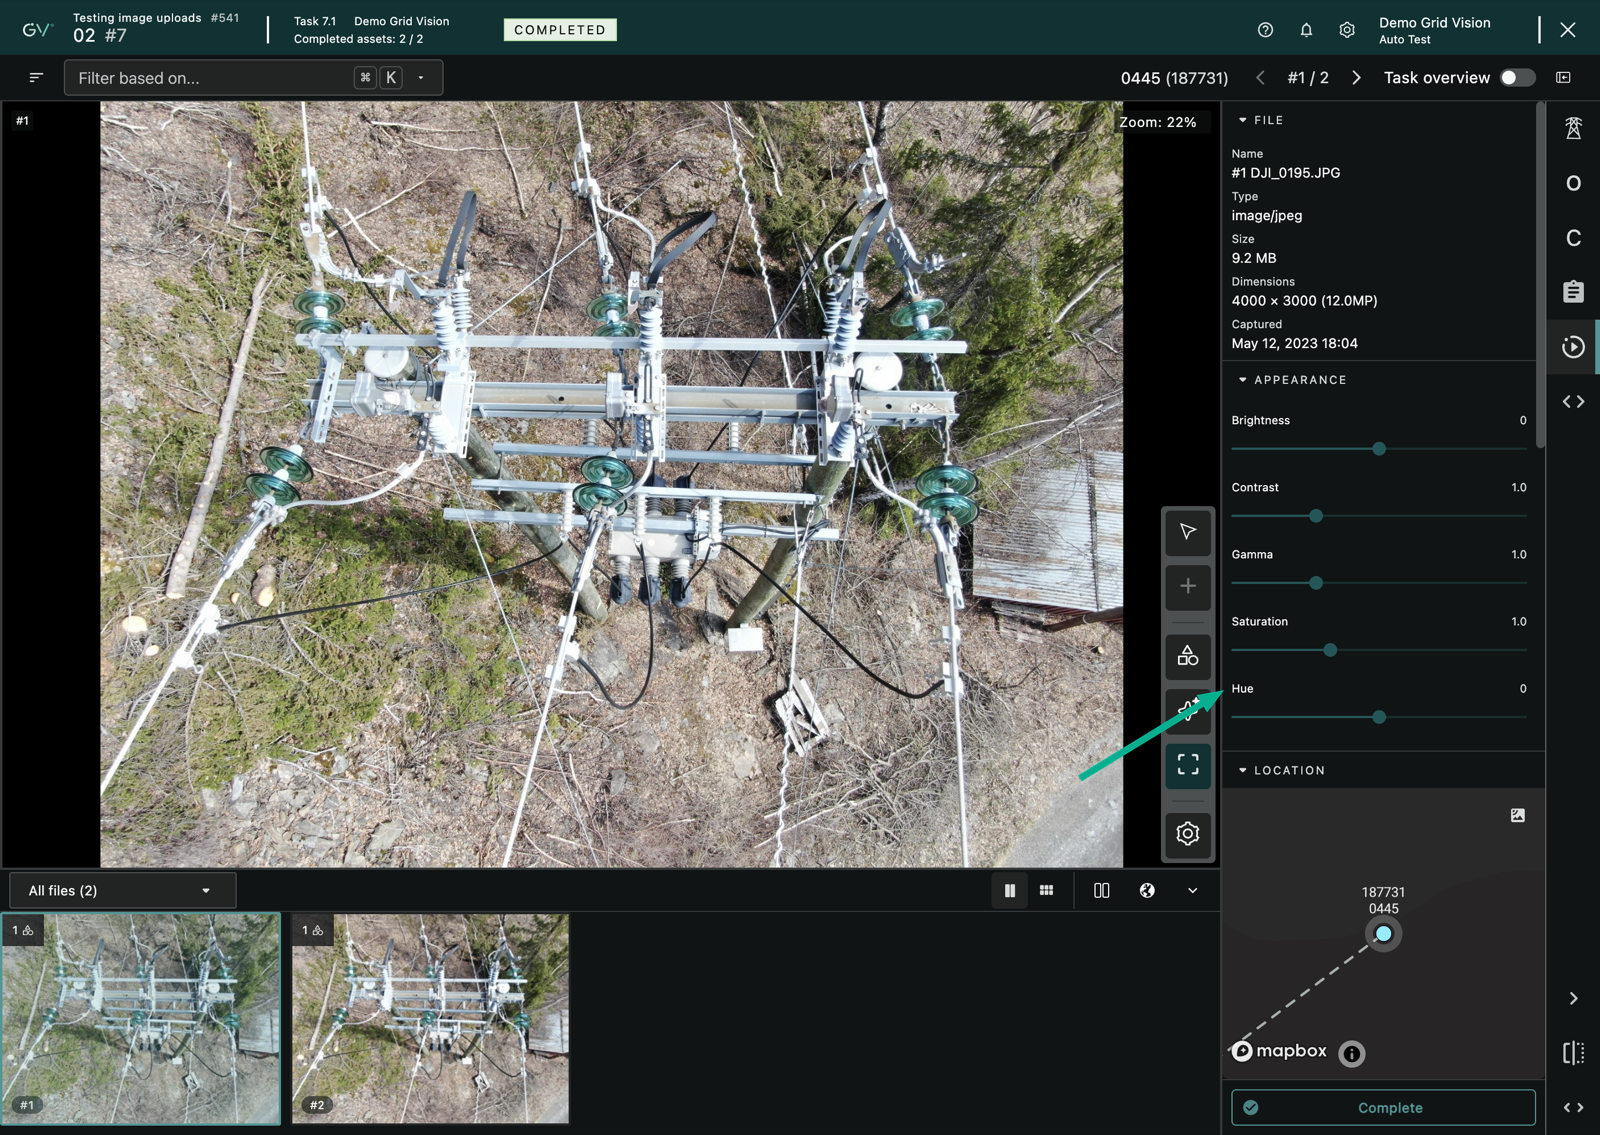
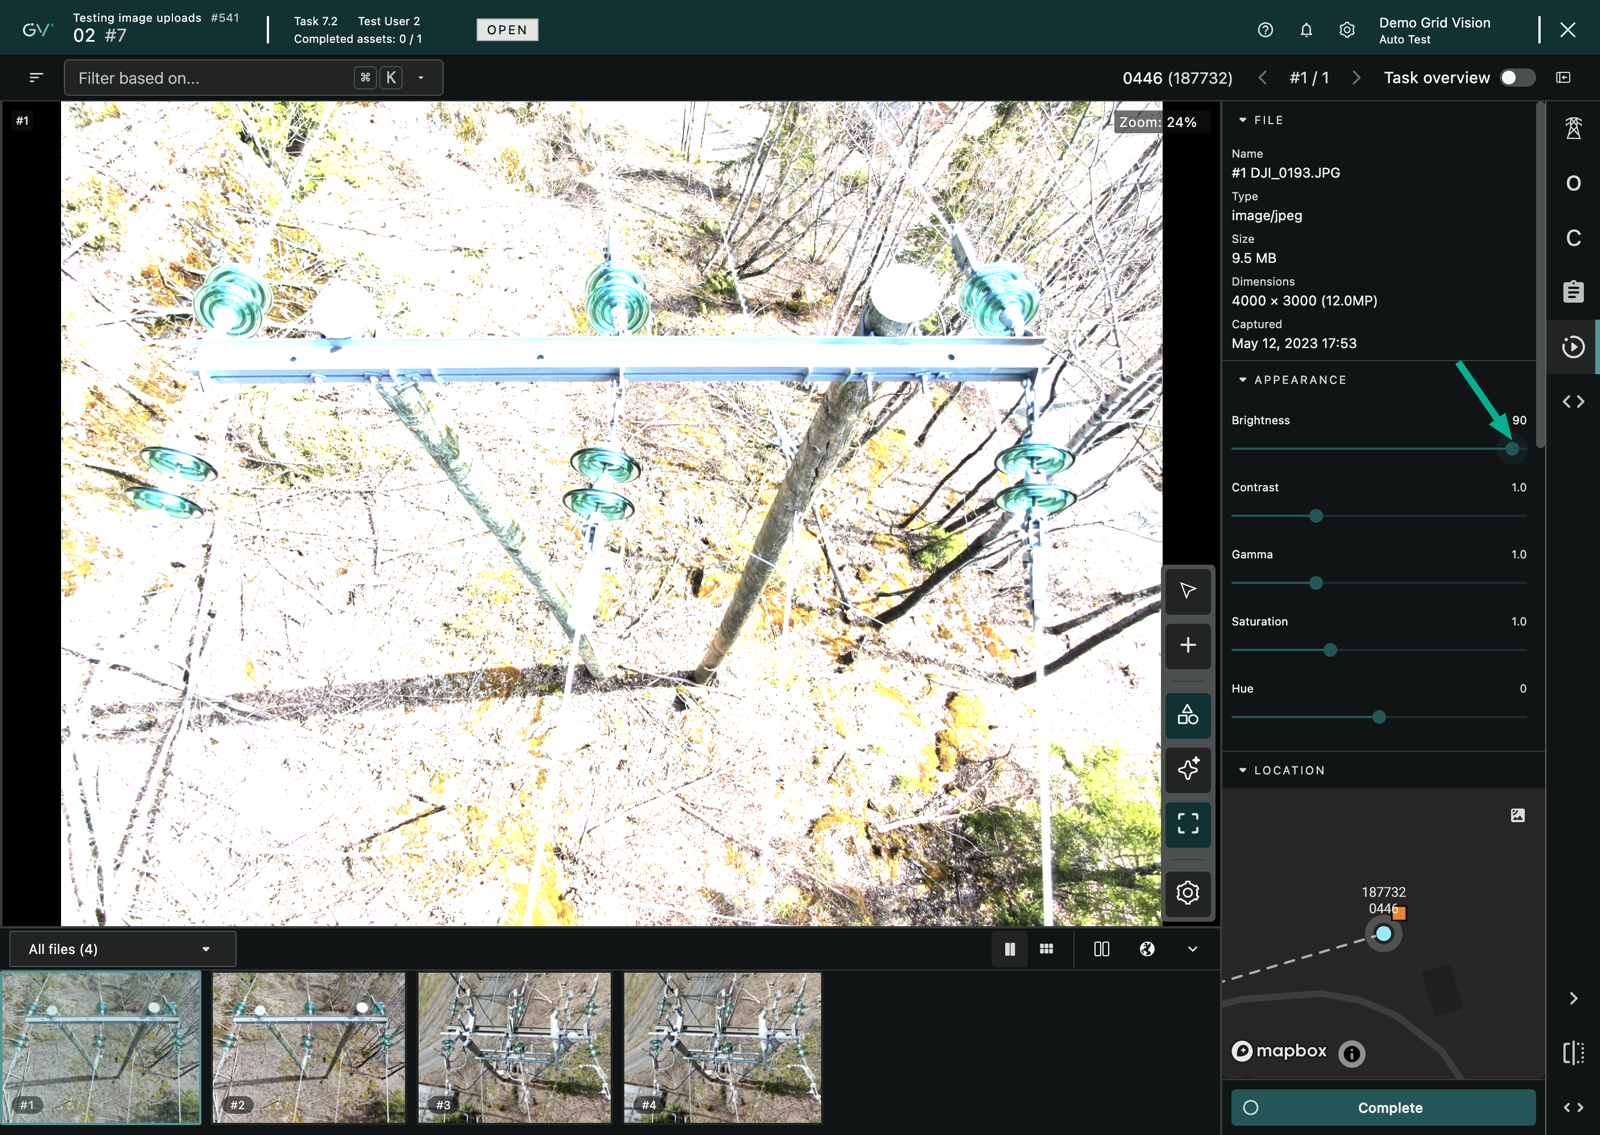
- Open the image in Inspect and go to the File details tab in the side panel, where the appearance controls sit in the Appearance section.
- Drag a slider to adjust that setting. The image updates as you move it.
- Use the toggles to invert the image or view it in greyscale.
-
Click Reset to return every setting to its default. Reset appears once you have changed something.
What you can adjust
The controls cover the common ways to change how an image reads.
- Brightness and Contrast for overall exposure and separation.
- Gamma for mid-tone balance.
- Saturation and Hue for colour.
- Sharpness to crisp up edges.
- Shadows and Highlights to recover detail at each end of the range.
- Invert and Greyscale toggles for a different view of the same image.
These adjustments change only your view. They do not alter the stored file, and resetting returns the image to how it was captured.
Keyboard shortcuts
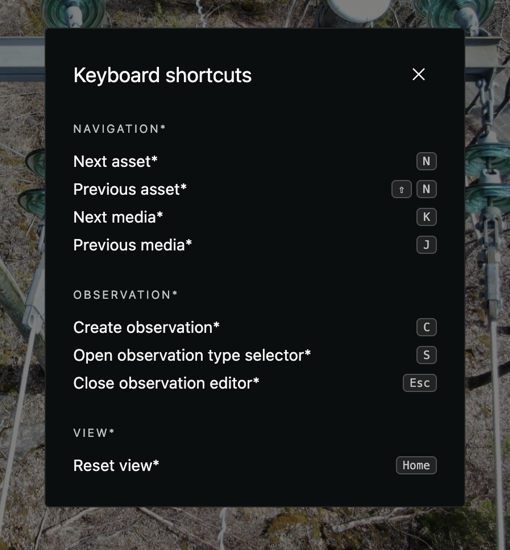
Inspect has keyboard shortcuts for the moves you make most often, so you can work through a task without reaching for the toolbar each time. You can see the full list at any time from the shortcuts legend, which you open from the feature-guide button in Inspect.
- Press n to go to the next asset, and Shift+n to go to the previous asset.
- Press k to go to the next media, and j to go to the previous media.
- Press c to start a new observation, and s to open the observation type selector.
- Press Esc to close the observation editor.
-
Press Home to reset the view and fit the whole image back into the viewer.
Thermal temperature reader
On a thermal image, Inspect can read the temperature at any point you click, so you can check a hot spot without leaving the viewer. A click-to-read toggle appears on the image toolbar when the file you are viewing is a thermal one, and the side panel gains a Thermal tab that shows the readings for the scene.
Steps to read a temperature
- Open a thermal image in Inspect.
- Click the click-to-read toggle on the image toolbar to turn it on.
- Click a point on the image. A marker drops at that point showing the temperature there.
- Click another point to read it instead. You can still pan and zoom the image while click-to-read is on, because only a genuine click takes a reading.
- Click the toggle again to turn click-to-read off and clear the marker.
The readings panel
The Thermal tab shows the temperature readings for the image. It gives you the scene's highest, lowest and average temperatures, and the value at the point you last clicked, and a colour scale shows the temperature range and where your readings fall on it. The panel also lists the correction parameters used to work out the temperatures, such as the ambient temperature, emissivity, reflection, distance and humidity. Where a value comes from the image's own data it is used automatically, and you can enter the ambient temperature yourself when it is not already known.
The readings you take this way are for reference. When you want to record a temperature as part of a defect, capture the hot spots and a reference point while you create the thermal observation.